Ultrasonic Sensors & Graph Matching: Play, then learn

In my physics class this morning, the plan was to have students work through a packet of descriptions of constant velocity motion. Each description was either a position vs. time graph, a velocity vs. time graph, or a motion map. Students would then sketch the corresponding velocity/position graphs, and then actually act out these scenarios in front of an ultrasonic detector. With a live graph showing them what their position vs. time graphs were as they moved, mayhem invariably would result.

I had a last minute change to my plan this morning. Following the ideal set out by one of my favorite books as a kid and my favorite museum (the Exploratorium), I asked ‘how can we play with this?’

I had the sensor ready to go at the start of class. I told a student to walk back and forth in front of it while data was collected. I didn’t have to give any other instruction – they saw how their movement resulted in a graph.

I then put two post-it notes on the screen and told another student to make the graph hit them both:

Screen Shot 2014-09-03 at 5.46.41 PM

This was probably the first time since the first day of school that the class was all smiles.

After they had this figured out, I gave them another task: hit the post-it notes, but also make the graph go along a string taped to the wall:

Screen Shot 2014-09-03 at 5.49.15 PM

This took a bit more time for developing intuition, but they got this down.

It was only at this point when I introduced the packet of scenarios. They went right to work and sped their way through, helping each other when differences arose.

My usual assessment activity for this has always been that I could call each student up to generate a specific graph. Since they don’t know who I’m going to call until the last minute, they ideally would work to understand how to generate each graph in front of the detector so that they were ready in case I called them up.

A student this morning said point blank that this plan did not sound fun at all. When I thought about it a bit more, I realized it was a fear based activity. The student instead suggested that I call each of them up, and give a number for a graph that needed to be generated, and the rest of the class could guess which one it was.

Clearly a superior idea. We proceeded to run the activity this way, and it was a blast.

I’m not sure why I haven’t done this activity this way in the past. It’s obviously superior to almost anything else for a number of reasons.

  • The activity starts with no numbers, just intuition and feedback. It’s fun seeing your own movement be simultaneously measured and displayed in front of you. The need to communicate about the process is where the vocabulary and numerical measurement comes in – that’s a perfect place for a teacher to step in once students are digging the activity.
  • The idea of setting an origin and detailing the meaning for increasing or decreasing position values isn’t necessary here. Students figure out quickly how these relate to their own movement without any intervention on my part.
  • Any activity that gets teenagers out of their seats and moving around during the first block of the day (and does so in a way that also directly serves the learning goals of a lesson) is going to be vastly superior to pretty much everything.

A great way to open a rainy Wednesday in Hangzhou, by any measure.

Uncertainty about Uncertainty in IB Science

I have a student that is taking both IB Physics with me and IB Chemistry with another science teacher. The first units in both courses have touched on managing uncertainty in data and calculations, so she has had the pleasure (horror) of seeing how we both handle it. For the most part, our references and procedures have been the same.

Today we worked on propagating error through the calculation $$\Delta x = \frac{1}{2}at^2$$ with uncertainties given for acceleration and time. The procedure I’ve been following (which follows from my experiences in college and my IB textbooks) is to determine relative error like this:

\(\frac{\delta x}{\Delta x} = \frac{\Delta a}{a} + 2 \cdot \frac{\Delta t}{t}\)

In chemistry, they are apparently multiplying uncertainty by 0.5 since it is a constant multiplying quantities with uncertainty. On a quick search, I found this site from the Columbia University physics department that seems to agree with this approach.

My student is struggling to know exactly what she should do in each case. I told her that everything I’ve seen from the IB resources I have in physics supports my approach. The direct application of the formula suggests that an exact number (like 1/2) has zero uncertainty, so it shouldn’t be involved in the calculation of relative error. That said, the different books I’ve used to plan my lessons agree with each other to around 95%. There is uncertainty about uncertainty within the textbooks discussing how to manage uncertainty. Theory of knowledge teachers would love the fact that teachers of a generally objective field (such as science) have to occasionally acknowledge to our students that textbooks don’t tell the entire story.

The reality is that there are a number of ways to handle uncertainty out in the world. Professionals do not always agree on the best approach – this conversation on the Physics Stack Exchange has a number of options and the mathematical basis behind them. For students that are used to having one correct answer, this is a major change in philosophy.

Thus far in my teaching career, I haven’t delved this deeply into uncertainty. The AP Physics curriculum doesn’t require a deep treatment of the concepts and roughly ignores significant figures as well. I talked about some of the issues with uncertainty with students, but I never felt it was necessary to get our hands really dirty with it because it wasn’t being assessed. We also learned error analysis in my experimental design courses in college, and it was part of the discussion there, but it was never the class discussion. It’s really interesting to think about these issues with students, but it’s also really difficult.

It seems that the questions that have resulted both from class and for my own understanding are exactly the style of conflict that the IB organization hopes will result from its programs. The way this student throws her hands up in the air and asks ‘so what do I do’ and managing the frustration that results is the same difficulty that we as adults face in resolving daily problems that are real, and complex.

The philosophy that I shared with the students was to be aware of these issues, but not to fear them. It should be part of the conversation, but not its entirety, especially at the level of students that are new to physics. I’m confident that some of the discomfort will melt away as we do more experimentation and explore physics models that tend to describe the world with some level of accuracy. The frustration will yield to the fact that managing uncertainty is an important element of describing how our universe works.

Moving in circles, broom ball, and Newton’s cannonball

In physics today, we began our work in circular motion. I started by asking the class three questions:

  • When do you feel ‘heaviest’ on an elevator? When do you feel ‘lightest’?
  • When do you feel ‘heaviest’ on an airplane? When do you feel ‘lightest?’
  • When do you feel ‘heaviest’ on a swing? Lightest?

We discussed and shared ideas for a bit. I tried my hardest not to nudge anyone toward thinking they were right or wrong, as this was merely a test for intuition and experience. We then played a few rounds of circular ‘book’-ball, a variation of the standard modeling curriculum activity of broom ball from the modeling curriculum in which students use a textbook to push a ball in a circular path on a table. The students could not touch the ball with anything other than a single book at one time. A couple of students quickly established themselves as the masters:

I then had students draw the ball in three configurations as well as the force and velocity vectors for the ball at those locations. Students figured the right configuration much more quickly than in previous years:
8C4384A1 - image I think some of our work emphasizing the perpendicular nature of the normal force on surfaces in previous units may have helped on this one.

We then took a look at some vertical circles and analyzed them using what we knew from the last unit on accelerated motion together with our new intuition about circular motion.

We finished the class playing with my most recent web-app, Newton’s Cannonball. We haven’t discussed orbits at all, but I wanted them to get an intuitive sense of the concept of how a projectile could theoretically go into orbit. This was the latest generation of my parabolas to orbits exploration concept.

Computation & CAPM – From Models to Understanding

I wrote last spring about beginning my projectile motion unit with computational models for projectiles. Students focused on using the computer model alone to solve problems, which led into a discussion of a more efficient approach with less trial and error. The success of this approach made me wonder about introducing the much more simpler particle model for constant acceleration (abbreviated CAPM) using a computational model first, and then extending the patterns we observed to more general situations

We started the unit playing around with the Javascript model located here and the Geogebra data visualizer here.

The first activity was to take some position data for an object and model it using the CAPM model. I explained that the computational model was a mathematical tool that generated position and velocity data for a particle that traveled with constant acceleration. This was a tedious process of trial and error by design.

The purpose here was to show that if position data for a moving object could be described using a CAPM model, then the object was moving with constant acceleration. The tedium drove home the fact that we needed a better way. We explored some different data sets for moving objects given as tables and graphs and discussed the concepts of acceleration and using a linear model for velocity. We recalled how we can use a velocity vs. time graph to find displacement. That linear model for velocity, at this point, was the only algebraic concept in the unit.

In previous versions of my physics course, this was where I would nudge students through a derivation of the constant acceleration equations using what we already understood. Algebra heavy, with some reinforcement from the graphs.

This time around, my last few lessons have all started using the same basic structure:

  1. Here’s some graphical or numerical data for position versus time or a description of a moving object. Model it using the CAPM data generator.
  2. Does the CAPM model apply? Have a reason for your answer.
  3. If it does, tell me what you know about its movement. How far does it go? What is its acceleration? Initial velocity? Tell me everything that the data tells you.

For our lesson discussing free fall, we started using the modeling question of asking what we would measure to see if CAPM applies to a falling object. We then used a spark timer (which I had never used before, but found hidden in a cabinet in the lab) to measure the position of a falling object.Screen Shot 2013-11-01 at 5.03.23 PM

They took the position data, modeled it, and got something similar to 9.8 m/s2 downward. They were then prepared to say that the acceleration was constant and downwards while it was moving down, but different when it was moving up. They quickly figured out that they should verify this, so they made a video and used Logger Pro to analyze it and see that indeed the acceleration was constant.

The part that ended up being different was the way we looked at 1-D kinematics problems. I still insisted that students use the computer program to model the problem and use the results to answer the questions. After some coaching, the students were able to do this, but found it unsatisfying. When I assigned a few of these for students to do on their own, they came back really grumpy. It took a long time to get everything in the model to work just right – never on the first try did they come up with an answer. Some figured out that they could directly calculate some quantities like acceleration, which reduced the iteration a bit, but it didn’t feel right to them. There had to be a better way.

This was one of the problems I gave them. It took a lot of adjustment to get the model to match what the problem described, but eventually they got it:
Screen Shot 2013-11-01 at 5.11.47 PM

Once the values into the CAPM program and it gave us this data, we looked at it together to answer the question. Students started noticing things:

  • The maximum height is half of the acceleration.
  • The maximum height happens halfway through the flight.
  • The velocity goes to zero halfway through the flight.

Without any prompting, students saw from the data and the graph that we could model the ball’s velocity algebraically and find a precise time when the ball was at maximum height. This then led to students realizing that the area of the triangle gave the displacement of the ball between being thrown and reaching maximum height.

This is exactly the sort of reasoning that students struggle to do when the entire treatment is algebraic. It’s exactly the sort of reasoning we want students to be doing to solve these problems. The computer model doesn’t do the work for students – it shows them what the model predicts, and leaves the analysis to them.

The need for more accuracy (which comes only from an algebraic treatment) then comes from students being uncomfortable with an answer that is between two values. The computation builds a need for the algebraic treatment and then provides some of the insight for a more generalized approach.

Let me also be clear about something – the students are not thrilled about this. I had a near mutiny during yesterday’s class when I gave them a standards quiz on the constant acceleration model. They weren’t confident during the quiz, most of them wearing gigantic frowns. They don’t like the uncertainty in their answers, they don’t like lacking a clear roadmap to a solution, they don’t like being without a single formula they can plug into to find an answer. They said these things even after I graded the quizzes and they learned that the results weren’t bad.

I’m fine with that. I’d rather that students are figuring out pathways to solutions through good reasoning than blindly plugging into a formula. I’d rather that all of the students have a way in to solving a problem, including those that lack strong algebraic skills. Matching a model to a problem or situation is not a complete crap shoot. They find patterns, figure out ways to estimate initial velocity or calculate acceleration and solidify one parameter to the model before adjusting another.

Computational models form one of the only ways I’ve found that successfully allows students of different skill levels to go from concrete to abstract reasoning in the context of problem solving in physics. Here’s the way the progression goes up the ladder of abstraction for the example I showed above:

  1. The maximum height of the ball occurred at that time. Student points to the graph.
  2. The maximum height of the ball happened when the velocity of the ball went to zero in this situation. I’ll need to adjust my model to find this time for different problems.
  3. The maximum height of the ball always occurs when the velocity of the ball goes to zero. We can get this approximate time from the graph.
  4. I can model the velocity algebraically and figure out when the ball velocity goes to zero exactly. Then we can use the area to find the maximum height.
  5. I can use the algebraic model for velocity to find the time when the ball has zero velocity. I can then create an algebraic model for position to get the position of the ball at this time.

My old students had to launch themselves up to step five of that progression from the beginning with an algebraic treatment. They had to figure out how the algebraic models related to the problems I gave them. They eventually figured it out, but it was a rough slog through the process. This was my approach for the AP physics students, but I used a mathematical approach for the regular students as well because I thought they could handle it. They did handle it, but as a math problem first. At the end, they returned to physics land and figured out what their answers meant.

There’s a lot going on here that I need to process, and it could be that I’m too tired to see the major flaws in this approach. I’m constantly asking myself ‘why’ algebraic derivations are important. I still do them in some way, which means I still see some value, but the question remains. Abstracting concepts to general cases in physics is important because it is what physicists do. It’s the same reason we should be modeling the scientific method and the modeling process with students in both science and math classes – it’s how professionals work within the field.

Is it, however, how we should be exposing students to content?

Same Skills, Virtual Car: Constant Velocity Particle Model

I had everything in line to start the constant velocity model unit: stop watches, meter sticks, measuring tape. All I had to do was find the set of working battery operated cars that I had used last year. I found one of them right where I left it. Upon finding another one, I remembered that didn’t work last year either, and I hadn’t gotten a replacement. The two other cars were LEGO robot cars that I had built specifically for this task, and all I would need would be to build those cars, program them to run their motors forward, and I was ready to go.

Then I remembered that my computer had been swapped for a new model over the summer, so my old LEGO programming applications were gone. Install software nowhere to be found, I went to the next option: buying new ones.

I made my way to a couple stores that sold toys and had sold me one of the cars from last year. They only had remote control ones, and I didn’t want to add the variable of taping the controllers to the on position so they would run forward. Having a bunch of remote control cars in class is a recipe for distraction. In a last ditch effort to try to improve the one working car that I had, I ended up snapping the transmission off of the motor. I needed another option.

John Burk’s post about using some programming in this lab and ending it in a virtual race had me thinking how to address the hole I had dug myself into. I have learned that the challenge of running the Python IDE on a class of laptops in various states of OSX make it tricky to have students use Visual Python or even the regular Python environment.

I have come to embrace the browser as the easiest portal for having students view and manipulate the results of a program for the purposes of modeling. Using Javascript, the Raphael drawing framework, Camtasia, and a bit of hurried coding, I was able to put together the following materials:
Screen Shot 2013-08-25 at 3.19.57 PM
Car 1 Part 1
Car-2-Model-
Constant Velocity model data generator (HTML)

When it came to actually running the class, I asked students to generate a table of time (in seconds) and position data (in meters) for the car from the video. The goal was to be able to figure out when the car would reach the white line. I found the following:

  • Students were using a number of different measuring tools to make their measurements. Some used rulers in centimeters or inches, others created their own ruler in units of car lengths. The fact that they were measuring a virtual car rather than a real one made no difference in terms of the modeling process of deciding what to measure, and then measuring it.
  • Students asked for the length of the car almost immediately. They realized that the scale was important, possibly as a consequence of some of the work we did with units during the preceding class.
  • By the time it came to start generating position data, we had a realization about the difficulty arising from groups lacking a common origin. Students tended to agree on velocity as was expected, but their inability This was especially the case when groups were transitioning to the data from Car 2.
  • Some students saw the benefit of a linear regression immediately when they worked with the constant velocity model data generator. They saw that they could use the information from their regression in the initial values for position, time, and velocity. I didn’t have to say a thing here – they figured it out without requiring a bland introduction to the algebraic model in the beginning.
  • I gave students the freedom to sketch a graph of their work on a whiteboard, on paper, or using Geogebra. Some liked different tools. Our conversation about the details afterwards was the same.

I wish I had working cars for all of the groups, but that’s water under the bridge. I’ve grown to appreciate the flexibility that computer programming has in providing full control over different aspects of a simulation. It would be really easy to generate and assign each group a different virtual car, have them analyze it, and then discuss among themselves who would win in a race. Then I hit play and we watch it happen. This does get away from some of the messiness inherent in real objects that don’t drive straight, or slow down as the batteries die, but I don’t think this is the end of the world when we are getting started. Ignoring that messiness forever would be a problem, but providing a simple atmosphere for starting exploration of modeling as a philosophy doesn’t seem to be a bad way to introduce the concept.

Day 1 in Physics – Models vs. Explanations

One of my goals has always been to differentiate my job from that of a paid explainer. Good teaching is not explaining exclusively – though it can be part of the process. This is why many people seek a great video or activity that thoroughly explains a concept that puzzles them. The process of learning should be an interactive one. An explanation should lead into another question, or an activity that applies the concept.

For the past two years, I’ve done a demo activity to open my physics class that emphasizes the subtle difference between a mental model for a phenomenon and having just a good explanation for it. A mental model makes predictions and is therefore testable. An explanation is the end of a story.

The demo equipment involves a cylindrical neodymium magnet and an aluminum tube of diameter slightly larger than the magnet. It is the standard eddy current/Lenz’s law/electromagnetic induction demo showing what happens when a magnet is dropped into a tube that is of a non-magnetic material. What I think I’ve been successful at doing is converting the demo into an experience that opens the course with the creation of a mental model and simultaneous testing of that model.

IMG_1016

I walk into the back of the classroom with the tube and the magnet (though I don’t tell them that it is one) and climb on top of a table. I stand with the tube above the desk and drop the magnet concentrically into the tube.

Students watch what happens. I ask for them to share their observations. A paraphrased sample:

  • The thing fell through the tube slowly than it should have
  • It’s magnetic and is slowing down because it sticks to the side
  • There’s so much air in the tube that it slows down the falling object.

I could explain that one of them is correct. I don’t. I first ask them to turn their observation into an assertion that should then be testable by some experiment. ‘The object is a magnet’ becomes ‘if the object is a magnet, then it should stick to something made out of steel.’ This is then an experiment we can do, and quickly.

When the magnet sticks strongly to the desk, or paper clips, or that something else happens that establishes that the object is magnetic, we can further develop our mental model for what is happening. Since the magnet sticks to steel, and the magnet seems to slow down when it falls, the tube must be made of some magnetic metal. How do we test this? See if the magnet sticks to the tube. The fact that it doesn’t stick as it did to the steel means that our model is incomplete.

Students then typically abandon the magnet line of reasoning and go for air resistance. If they went for this first (as has happened before) I just reverse the order of these experiments with the above magnetic discussion. If the object is falling slowly, it must be because the air is slowing it down. How do we test this? From the students: drop another object that is the same size as the first and see if it falls at the same speed. I have a few different objects that I’ve used for this – usually an aluminum plug or part from the robotics kit works – but the students also insist on taping up the holes that these objects have so that it is as close to the original object as possible. It doesn’t fall at the same speed though. When students ask to add mass to the object, I oblige with whatever materials I have on hand. No change.

The mental model is still incomplete.

We’ve tried changing the object – what about the tube? Assertion from the students: if the material for the tube matters, then the object should fall at a different speed with a plastic tube. We try the experiment with a PVC pipe and see that the magnet speeds along quite unlike it did in the aluminum tube. This confirms our assertion – this is moving us somewhere, though it isn’t clear quite where yet.

Students also suggest that friction is involved – this can still be pushed along with the assertion-experiment process. What would you expect to observe if friction is a factor? Students will say they should hear it scraping along or see it in contact with the edges of the tube. I invited a student to stare down the end of the tube as I dropped the magnet. He was noticeably excited by seeing it hover lightly down the entire length of the tube, only touching its edges periodically.

Students this year asked to change the metal itself, but I unfortunately didn’t have a copper tube on hand. That would have been awesome if I had. They asked if it would be different if the tube was a different shape. Instead of telling them, I asked them what observation they would expect to make if the tube shape mattered. After they made their assertion, I dropped the magnet into a square tube, and the result was very similar to with the circular tube.

All of these experiments make clear that the facts that (a) the object is a magnet and (b) the tube is made of metal are somehow related. I did at this point say that this was a result of a phenomenon called electromagnetic induction. For the first time during the class, I saw eyes glaze over. I wish I hadn’t gone there. I should have just said that we will eventually develop some more insight into why this might happen, but for now, let’s be happy that we’ve developed some understanding of what factors are involved.

All of these opportunities to get students making assertions and then testing them is the scientific method as we normally teach it. The process is a lot less formal than having them write a formal hypothesis, procedure, and conclusion in a lab report – appropriate given that it was the first day of the class – and it makes clear the concept of science as an iterative process. It isn’t a straight line from a question to an answer, it is a cyclical process that very often gets hidden when we emphasize the formality of the scientific method in the form of a written lab report. Yes, scientists do publish their findings, but this isn’t necessarily what gets them up in the morning.

Some other thoughts:

  • This process emphasizes the value of an experiment either refuting or supporting our hypothesis. There is a consequence to a mental model when an experiment shows what we expected it to show. It’s equally instructive when it doesn’t.I asked the students how many times we were wrong in our exploration of the demo. They counted more than five or six. How often do we provide opportunities for students to see how failure is helpful? We say it. Do we show how?
  • I finally get why some science museums drive me nuts. At their worst, they are nothing more than clusters of express buses from observation/experiment to explanation. Press the button/lift the flap/open the window/ask the explainer, get the answer. If there’s not another step to the exhibit that involves an application of what was learned, an exhibit runs the risk of continuing to perpetuate science as a box of answers you don’t know. I’m not saying there isn’t value in tossing a bunch of interesting experiences at visitors and knowing that only some stuff will stick. I just think there should be a low floor AND a high ceiling for the activities at a good museum.
  • Mental models must be predictive within the realm in which they are used. If you give students a model for intangible phenomena – the lock and key model for enzymes in biology for example – that model should be robust enough to have students make assertions and predictions based on their conception of the model, and test them. The lock and key model works well to explain why enzymes can lose effectiveness under high temperature because the shape of the active site changing (real world) matches our conception of a key being of the wrong shape (model). Whenever possible, we should expose students to places where the model breaks down, if for no other reason, to show that it can. By definition, it is an incomplete representation of the universe.

2012-2013 Year In Review – Learning Standards

This is the second post reflecting on this past year and I what I did with my students.

My first post is located here. I wrote about this year being the first time I went with standards based grading. One of the most important aspects of this process was creating the learning standards that focused the work of each unit.

What did I do?

I set out to create learning standards for each unit of my courses: Geometry, Advanced Algebra (not my title – this was an Algebra 2 sans trig), Calculus, and Physics. While I wanted to be able to do this for the entire semester at the beginning of the semester, I ended up doing it unit by unit due to time constraints. The content of my courses didn’t change relative to what I had done in previous years though, so it was more of a matter of deciding what themes existed in the content that could be distilled into standards. This involved some combination of concepts into one to prevent the situation of having too many. In some ways, this was a neat exercise to see that two separate concepts really weren’t that different. For example, seeing absolute value equations and inequalities as the same standard led to both a presentation and an assessment process that emphasized the common application of the absolute value definition to both situations.

What worked:

  • The most powerful payoff in creating the standards came at the end of the semester. Students were used to referring to the standards and knew that they were the first place to look for what they needed to study. Students would often ask for a review sheet for the entire semester. Having the standards document available made it easy to ask the students to find problems relating to each standard. This enabled them to then make their own review sheet and ask directed questions related to the standards they did not understand.
  • The standards focus on what students should be able to do. I tried to keep this focus so that students could simultaneously recognize the connection between the content (definitions, theorems, problem types) and what I would ask them to do with that content. My courses don’t involve much recall of facts and instead focus on applying concepts in a number of different situations. The standards helped me show that I valued this application.
  • Writing problems and assessing students was always in the context of the standards. I could give big picture, open-ended problems that required a bit more synthesis on the part of students than before. I could require that students write, read, and look up information needed for a problem and be creative in their presentation as they felt was appropriate. My focus was on seeing how well their work presented and demonstrated proficiency on these standards. They got experience and got feedback on their work (misspelling words in student videos was one) but my focus was on their understanding.
  • The number standards per unit was limited to 4-6 each…eventually. I quickly realized that 7 was on the edge of being too many, but had trouble cutting them down in some cases. In particular, I had trouble doing this with the differentiation unit in Calculus. To make it so that the unit wasn’t any more important than the others, each standard for that unit was weighted 80%, a fact that turned out not to be very important to students.

What needs work:

  • The vocabulary of the standards needs to be more precise and clearly communicated. I tried (and didn’t always succeed) to make it possible for a student to read a standard and understand what they had to be able to do. I realize now, looking back over them all, that I use certain words over and over again but have never specifically said what it means. What does it mean to ‘apply’ a concept? What about ‘relate’ a definition? These explanations don’t need to be in the standards themselves, but it is important that they be somewhere and be explained in some way so students can better understand them.
  • Example problems and references for each standard would be helpful in communicating their content. I wrote about this in my last post. Students generally understood the standards, but wanted specific problems that they were sure related to a particular standard.
  • Some of the specific content needs to be adjusted. This was my first year being much more deliberate in following the Modeling Physics curriculum. I haven’t, unfortunately, been able to attend a training workshop that would probably help me understand how to implement the curriculum more effectively. The unbalanced force unit was crammed in at the end of the first semester and worked through in a fairly superficial way. Not good, Weinberg.
  • Standards for non-content related skills need to be worked in to the scheme. I wanted to have some standards for year or semester long skills standards. For example, unit 5 in Geometry included a standard (not listed in my document below) on creating a presenting a multimedia proof. This was to provide students opportunities to learn to create a video in which they clearly communicate the steps and content of a geometric proof. They could create their video, submit it to me, and get feedback to make it better over time. I also would love to include some programming or computational thinking standards as well that students can work on long term. These standards need to be communicated and cultivated over a long period of time. They will otherwise be just like the others in terms of the rush at the end of the semester. I’ll think about these this summer.

You can see my standards in this Google document:
2012-2013 – Learning Standards

I’d love to hear your comments on these standards or on the post – comment away please!

Speed of sound lab, 21st century version

I love the standard lab used to measure the speed of sound using standing waves. I love the fact that it’s possible to measure physical quantities that are too fast to really visualize effectively.

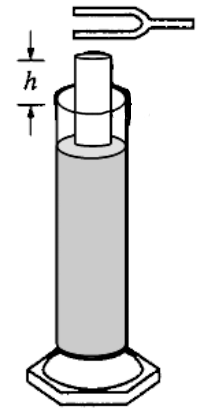
This image from the 1995 Physics B exam describes the basic set-up:
Screen Shot 2013-05-16 at 3.43.30 PM

The general procedure involves holding a tuning fork at the opening of the top of the tube and then raising and lowering the tube in the graduated cylinder of water until the tube ‘sings’ at the frequency of the tuning fork. The shortest height at which this occurs is the fundamental frequency of vibration of the air in the tube, and this can be used to find the speed of sound waves in the air.

The problem is in the execution. A quick Google search for speed of sound labs for high school and university settings all use tuning forks as the frequency source. I have always found the same problems come up every time I have tried to do this experiment with tuning forks:

  • Not having enough tuning forks for the whole group. Sharing tuning forks is fine, but raises the lower limit required for the whole group to complete the experiment.
  • Not enough tuning forks at different frequencies for each group to measure. At one of my schools, we had tuning forks of four different frequencies available. My current school has five. Five data points for making a measurement is not the ideal, particularly for showing a linear (or other functional) relationship.
  • The challenge of simultaneously keeping the tuning fork vibrating, raising and lowering the tube, and making height measurements is frustrating. This (together with sharing tuning forks) is why this lab can take so long just to get five data points. I’m all for giving students the realistic experience of the frustration of real world data collection, but this is made arbitrarily difficult by the equipment.

So what’s the solution? Obviously we don’t all have access to a lab quality function generator, let alone one for every group in the classroom. I have noticed an abundance of earphones in the pockets of students during the day. Earphones that can easily play a whole bunch of frequencies through them, if only a 3.5 millimeter jack could somehow be configured to play a specific frequency waveform. Where might we get a device that has the capacity to play specific (and known) frequencies of sound?

I visited this website and generated a bunch of WAV files, which I then converted into MP3s. Here is the bundle of sound files we used:
SpeedOfSoundFrequencies

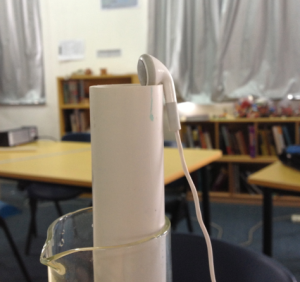
I showed the students the basics of the lab and was holding the earphone close to the top of the tube with one hand while raising the tube with the other. After getting started on their own, the students quickly found an additional improvement to the technique by using the hook shape of their earphones:
Screen Shot 2013-05-16 at 4.03.13 PM

Data collection took around 20 minutes for all students, not counting students retaking data for some of the cases at the extremes. The frequencies I used kept the heights of the tubes measurable given the rulers we had around to measure the heights. This is the plot of our data, linearized as frequency vs. 1/4L with an length correction factor of 0.4*diameter added on to the student data:
Screen Shot 2013-05-16 at 4.14.22 PM

The slope of this line is approximately 300 m/s with the best fit line allowed to have any intercept it wants, and would have a slightly higher value if the regression is constrained to pass through the origin. I’m less concerned with that, and more excited with how smoothly data collection was to make this lab much less of a headache than it has been in the past.

Visualizing the invisible – standing waves

I wrote a post more than a year ago on a standing waves lesson I did. Today I repeated that lesson with a few tweaks to maximize time spent looking at frequency space of different sounds. The Tuvan throat singers, a function generator, and a software frequency generator (linked here) again all made an appearance.

We focused on the visceral experience of listening to pure, single frequency sound and what it meant. We listened for the resonant frequencies of the classroom while doing a sweep of the audible spectrum. We looked at the frequency spectrum of noises that sounded smooth (sine wave) compared to grating (sawtooth). We looked at frequencies of tuning forks that all made the same note, but at different octaves, and a student had the idea of looking at ratios. That was the golden idea that led to interesting conclusions while staring at the frequency spectrum.

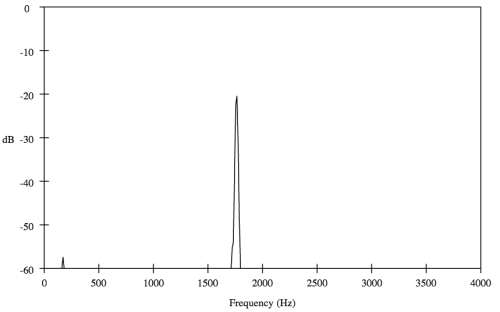
Here is a whistle:
Screen Shot 2013-05-13 at 3.10.40 PM
…a triangle wave (horizontal axis measured in Hz):

Screen Shot 2013-05-13 at 3.09.45 PM

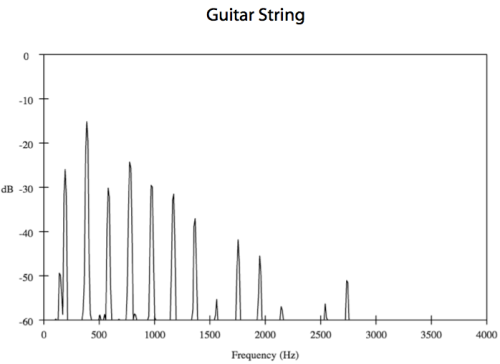
…a guitar string (bonus points if you identify which string it was:
Screen Shot 2013-05-13 at 3.12.14 PM

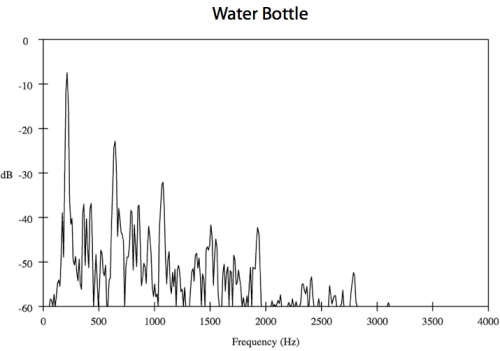
…and blowing across the rim of a water bottle:
Screen Shot 2013-05-13 at 3.14.04 PM

The ratios of frequencies for the guitar string are integer multiples of the fundamental – this is easily derived using a diagram and an equation relating a wave’s speed, frequency, and wavelength. It’s also easily seen in the spectrum image – all harmonics equally spaced with each other and with the origin. The bottle, closely modeled by a tube closed at one end, has odd multiples of the fundamental. Again, this is totally visible in the image above of the spectrum.

I’m just going to say it here: if you are teaching standing waves and are NOT using any kind of frequency analyzer of some sort to show your students what it means to vibrate at multiple frequencies at once, you are at best missing out, and at worst, doing it plain wrong.

Computational modeling & projectile motion, EPISODE IV

I’ve always wondered how I might assess student understanding of projectile motion separately from the algebra. I’ve tried in the past to do this, but since my presentation always started with algebra, it was really hard to separate the two. In my last three posts about this, I’ve detailed my computational approach this time. A review:

    • We used Tracker to manually follow a ball tossed in the air. It generated graphs of position vs. time for both x and y components of position. We recognized these models as constant velocity (horizontal) and constant acceleration particle models (vertical).
    • We matched graphical models to a given projectile motion problem and visually identified solutions. We saw the limitations of this method – a major one being the difficulty finding the final answer accurately from a graph. This included a standards quiz on adapting a Geogebra model to solve a traditional projectile motion problem.
    • We looked at how to create a table of values using the algebraic models. We identified key points in the motion of the projectile (maximum height, range of the projectile) directly from the tables or graphs of position and velocity versus time. This was followed with the following assessment
    • We looked at using goal seek in the spreadsheet to find these values more accurately than was possible from reading the tables.

After this, I gave a quiz to assess their abilities – the same set of questions, but asked first using a table…
Screen Shot 2013-03-08 at 6.55.40 PM
… and then using a graph:
Screen Shot 2013-03-08 at 6.57.23 PM

The following data describes a can of soup thrown from a window of a building.

  • How long is the can in the air?
  • What is the maximum height of the can?
  • How high above the ground is the window?
  • Is the can thrown horizontally? Explain your answer.
  • How far from the base of the building does the can hit the ground?
  • What is the speed of the can just before it hits the ground?</li

I was really happy with the results class wide. They really understood what they were looking at and answered the questions correctly. They have also been pretty good at using goal seek to find these values fairly easily.

I did a lesson that last day on solving the problems algebraically. It felt really strange going through the process – students already knew how to set up a problem solution in the spreadsheet, and there really wasn’t much that we gained from obtaining an algebraic solution by hand, at least in my presentation. Admittedly, I could have swung too far in the opposite direction selling the computational methods and not enough driving the need for algebra.

The real need for algebra, however, comes from exploring general cases and identifying the existence of solutions to a problem. I realized that these really deep questions are not typical of high school physics treatments of projectile motion. This is part of the reason physics gets the reputation of a subject full of ‘plug and chug’ problems and equations that need to be memorized – there aren’t enough problems that demand students match their understanding of how the equations describe real objects that move around to actual objects that are moving around.

I’m not giving a unit assessment this time – the students are demonstrating their proficiency at the standards for this unit by answering the questions in this handout:
Projectile Motion – Assessment Questions

These are problems that are not pulled directly out of the textbook – they all require the students to figure out what information they need for building and adapting their computer models to solve them. Today they got to work going outside, making measurements, and helping each other start the modeling process. This is the sort of problem solving I’ve always wanted students to see as a natural application of learning, but it has never happened so easily as it did today. I will have to see how it turns out, of course, when they submit their responses, but I am really looking forward to getting a chance to do so.