
Speed of sound lab, 21st century version
I love the standard lab used to measure the speed of sound using standing waves. I love the fact that it’s possible to measure physical quantities that are too fast to really visualize effectively.
This image from the 1995 Physics B exam describes the basic set-up:
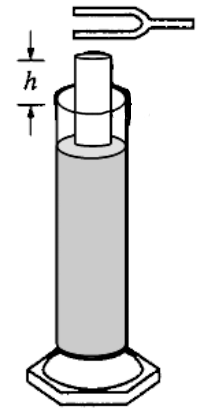
The general procedure involves holding a tuning fork at the opening of the top of the tube and then raising and lowering the tube in the graduated cylinder of water until the tube ‘sings’ at the frequency of the tuning fork. The shortest height at which this occurs is the fundamental frequency of vibration of the air in the tube, and this can be used to find the speed of sound waves in the air.
The problem is in the execution. A quick Google search for speed of sound labs for high school and university settings all use tuning forks as the frequency source. I have always found the same problems come up every time I have tried to do this experiment with tuning forks:
- Not having enough tuning forks for the whole group. Sharing tuning forks is fine, but raises the lower limit required for the whole group to complete the experiment.
- Not enough tuning forks at different frequencies for each group to measure. At one of my schools, we had tuning forks of four different frequencies available. My current school has five. Five data points for making a measurement is not the ideal, particularly for showing a linear (or other functional) relationship.
- The challenge of simultaneously keeping the tuning fork vibrating, raising and lowering the tube, and making height measurements is frustrating. This (together with sharing tuning forks) is why this lab can take so long just to get five data points. I’m all for giving students the realistic experience of the frustration of real world data collection, but this is made arbitrarily difficult by the equipment.
So what’s the solution? Obviously we don’t all have access to a lab quality function generator, let alone one for every group in the classroom. I have noticed an abundance of earphones in the pockets of students during the day. Earphones that can easily play a whole bunch of frequencies through them, if only a 3.5 millimeter jack could somehow be configured to play a specific frequency waveform. Where might we get a device that has the capacity to play specific (and known) frequencies of sound?
I visited this website and generated a bunch of WAV files, which I then converted into MP3s. Here is the bundle of sound files we used:
SpeedOfSoundFrequencies
I showed the students the basics of the lab and was holding the earphone close to the top of the tube with one hand while raising the tube with the other. After getting started on their own, the students quickly found an additional improvement to the technique by using the hook shape of their earphones:

Data collection took around 20 minutes for all students, not counting students retaking data for some of the cases at the extremes. The frequencies I used kept the heights of the tubes measurable given the rulers we had around to measure the heights. This is the plot of our data, linearized as frequency vs. 1/4L with an length correction factor of 0.4*diameter added on to the student data:

The slope of this line is approximately 300 m/s with the best fit line allowed to have any intercept it wants, and would have a slightly higher value if the regression is constrained to pass through the origin. I’m less concerned with that, and more excited with how smoothly data collection was to make this lab much less of a headache than it has been in the past.
Check out this app for ipad or iphone. Great signal generator and more useful in your physics labs http://studiosixdigital.com/audiotools/
Thanks Dad!
I’m going to try to incorporate a little of this into conceptual physics here at WVU. This is a great idea and the students already play with “Audacity” during the speed of sound lab.
Awesome – I’d love to hear how it goes. Keep me posted!
Hey Mr. Weinberg,
I was wondering how you were able to create that graph. I have to create a similar graph for my physics report, so your help would be greatly appreciated!
Hi Jordan,
I did this with Geogebra, but I’ve been more hooked on using Desmos these days for all my graphing needs. Lots of tutorials over there on how to do this. Let me know if you need any more insight into getting that done.