Visualizing the invisible – standing waves
I wrote a post more than a year ago on a standing waves lesson I did. Today I repeated that lesson with a few tweaks to maximize time spent looking at frequency space of different sounds. The Tuvan throat singers, a function generator, and a software frequency generator (linked here) again all made an appearance.
We focused on the visceral experience of listening to pure, single frequency sound and what it meant. We listened for the resonant frequencies of the classroom while doing a sweep of the audible spectrum. We looked at the frequency spectrum of noises that sounded smooth (sine wave) compared to grating (sawtooth). We looked at frequencies of tuning forks that all made the same note, but at different octaves, and a student had the idea of looking at ratios. That was the golden idea that led to interesting conclusions while staring at the frequency spectrum.
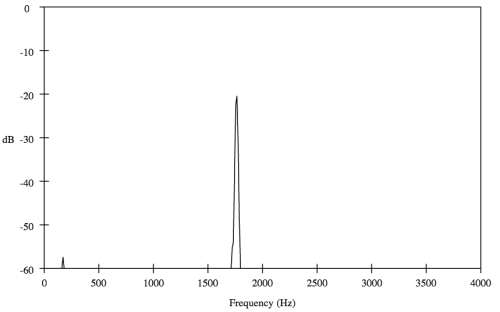
Here is a whistle:

…a triangle wave (horizontal axis measured in Hz):
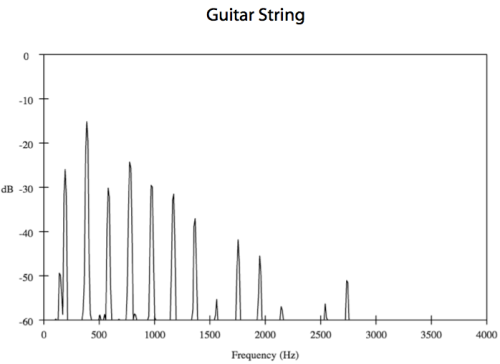
…a guitar string (bonus points if you identify which string it was:

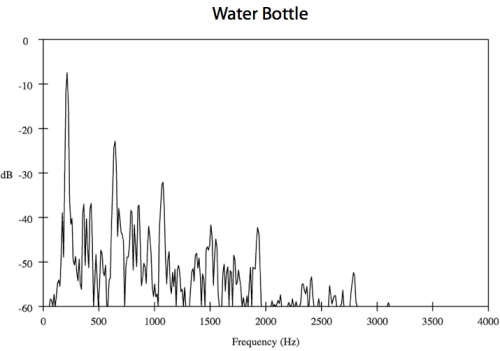
…and blowing across the rim of a water bottle:

The ratios of frequencies for the guitar string are integer multiples of the fundamental – this is easily derived using a diagram and an equation relating a wave’s speed, frequency, and wavelength. It’s also easily seen in the spectrum image – all harmonics equally spaced with each other and with the origin. The bottle, closely modeled by a tube closed at one end, has odd multiples of the fundamental. Again, this is totally visible in the image above of the spectrum.
I’m just going to say it here: if you are teaching standing waves and are NOT using any kind of frequency analyzer of some sort to show your students what it means to vibrate at multiple frequencies at once, you are at best missing out, and at worst, doing it plain wrong.

