Algebra and Programming – A Peek Ahead

I’m starting a new unit reviewing algebraic skills tomorrow. My students have most certainly moved through evaluating algebraic expressions, solving linear equations, and combining like terms before. Much of tomorrow’s class will involve me drifting between students working on this to get an idea of their skill level – certainly not a developmental lesson on these ideas unless I really see the need.

My question is on making these concepts new. The thing that comes to mind most immediately is using this as an opportunity to get students started on concepts of computational thinking. Students have seen the concepts of variables, substitution, and evaluation, but I think (and hope) that the ideas of using a computer to do these things is new enough to whet their appetites to potentially learn more.

What does the computer do well? (Compute).

What must we do to get it to do so? (Communicate to the computer correctly what we want to compute.)

After having my students do some algebraic evaluation on their own, I’m having them watch this short video:
M9 U2D1.1 – Web Browser & Math Hacking

Side Note:

Now that I see I can increase the font size in Chrome for the console, or zoom in using Camtasia, I can make the code much more visible than it is now. Work for the morning.

I can’t see an easier way to get students into a programming environment than this. Everyone has a web browser, and Safari and Chrome both give access to a Javascript console without too much work. There are websites like Code Academy that have a similar environment on their front page, but this method barely even requires accessing a web page.

I’ve had students install Python on their computers before, and it works well enough as long as there aren’t any operating system related hiccups. (IDLE does not run so well on OSX 10.5). I just like that this Javascript environment is hiding on student computers without having to do anything.

Other thoughts:

  • We have to tell the computer explicitly that 2x is 2*x. This is a fact that often gets glossed over when students haven’t seen it for a while.
  • Javascript doesn’t have an easy to access exponent symbol like Python or other languages do. To enter x3, you have to either type x*x*x (reinforcing the idea of the exponent for the win) or Math.pow(x,3) which is too abstract to even consider using with students.
  • Selling programming as a fast and easily accessible calculator isn’t a compelling pitch – I completely get that. At this point though, I’m not trying to sell the computer as the way to do things. My students all have computers with them in their classes. If making them unafraid to do something that feels a bit ‘under the hood’ might lead them to know what else is possible (which is a pitch that is coming really soon), I’m happy with this.

Same Skills, Virtual Car: Constant Velocity Particle Model

I had everything in line to start the constant velocity model unit: stop watches, meter sticks, measuring tape. All I had to do was find the set of working battery operated cars that I had used last year. I found one of them right where I left it. Upon finding another one, I remembered that didn’t work last year either, and I hadn’t gotten a replacement. The two other cars were LEGO robot cars that I had built specifically for this task, and all I would need would be to build those cars, program them to run their motors forward, and I was ready to go.

Then I remembered that my computer had been swapped for a new model over the summer, so my old LEGO programming applications were gone. Install software nowhere to be found, I went to the next option: buying new ones.

I made my way to a couple stores that sold toys and had sold me one of the cars from last year. They only had remote control ones, and I didn’t want to add the variable of taping the controllers to the on position so they would run forward. Having a bunch of remote control cars in class is a recipe for distraction. In a last ditch effort to try to improve the one working car that I had, I ended up snapping the transmission off of the motor. I needed another option.

John Burk’s post about using some programming in this lab and ending it in a virtual race had me thinking how to address the hole I had dug myself into. I have learned that the challenge of running the Python IDE on a class of laptops in various states of OSX make it tricky to have students use Visual Python or even the regular Python environment.

I have come to embrace the browser as the easiest portal for having students view and manipulate the results of a program for the purposes of modeling. Using Javascript, the Raphael drawing framework, Camtasia, and a bit of hurried coding, I was able to put together the following materials:
Screen Shot 2013-08-25 at 3.19.57 PM
Car 1 Part 1
Car-2-Model-
Constant Velocity model data generator (HTML)

When it came to actually running the class, I asked students to generate a table of time (in seconds) and position data (in meters) for the car from the video. The goal was to be able to figure out when the car would reach the white line. I found the following:

  • Students were using a number of different measuring tools to make their measurements. Some used rulers in centimeters or inches, others created their own ruler in units of car lengths. The fact that they were measuring a virtual car rather than a real one made no difference in terms of the modeling process of deciding what to measure, and then measuring it.
  • Students asked for the length of the car almost immediately. They realized that the scale was important, possibly as a consequence of some of the work we did with units during the preceding class.
  • By the time it came to start generating position data, we had a realization about the difficulty arising from groups lacking a common origin. Students tended to agree on velocity as was expected, but their inability This was especially the case when groups were transitioning to the data from Car 2.
  • Some students saw the benefit of a linear regression immediately when they worked with the constant velocity model data generator. They saw that they could use the information from their regression in the initial values for position, time, and velocity. I didn’t have to say a thing here – they figured it out without requiring a bland introduction to the algebraic model in the beginning.
  • I gave students the freedom to sketch a graph of their work on a whiteboard, on paper, or using Geogebra. Some liked different tools. Our conversation about the details afterwards was the same.

I wish I had working cars for all of the groups, but that’s water under the bridge. I’ve grown to appreciate the flexibility that computer programming has in providing full control over different aspects of a simulation. It would be really easy to generate and assign each group a different virtual car, have them analyze it, and then discuss among themselves who would win in a race. Then I hit play and we watch it happen. This does get away from some of the messiness inherent in real objects that don’t drive straight, or slow down as the batteries die, but I don’t think this is the end of the world when we are getting started. Ignoring that messiness forever would be a problem, but providing a simple atmosphere for starting exploration of modeling as a philosophy doesn’t seem to be a bad way to introduce the concept.

Class-sourcing data generation through games

In my newly restructured first units for ninth and tenth grade math, we tackle sets, functions, and statistics. In the past, teaching these topics have always involved collecting some sort of data relevant to the class – shoe size, birthday, etc. Even though making students part of the data collection has always been part of my plan, it always seems slower and more forced than I want it to be. I think the big (and often incorrect) assumption is that because the data is coming from students, they will find it relevant and enjoyable to collect and analyze.

This summer, I remembered a blog post from Dan Meyer not too long ago describing a brilliantly simple game shared by Nico Rowinsky on Twitter. I had tried this manually with pencil and paper and students since hearing about it. It always required a lot of effort collecting and ordering papers with student guesses, but student enthusiasm for the game usually compelled me to run a couple of rounds before getting tired of it. It screamed for a technology solution.

I spent some time this summer learning some of the features of the Meteor Javascript web framework after a recommendation from Dave Major. It has the real-time update capabilities that make it possible to collect numbers from students and reveal a scoreboard to all users simultaneously. You can see my (imperfect) implementation hosted at http://lownumber.meteor.com, and the code at Github here. Dave was, as always, a patient mentor during the coding process, eagerly sharing his knowledge and code prototypes to help me along.

If you want to start your own game with friends, go to lownumber.meteor.com/config/ and select ‘Start a new game’, then ask people to play. Wherever they are in the world, they will all see the results show up almost instantly when you hit the ‘Show Results’ button on that page. I hosted this locally on my laptop during class so that I could build a database of responses for analysis later by students.

The game was, as expected, a huge hit. The big payoff was the fact that we could quickly play five or six games in my class of twenty-two grade nine students in a matter of minutes and built some perplexity through the question of how one can increase his or her chances of winning. What information would you need to know about the people playing? What tools do we have to look at this data? Here comes statistics, kids.

It also quickly led to a discussion with the class about the use of computers to manage larger sets of data. Only in a school classroom would one calculate measures of central tendency by hand for a set of data that looks like this:
Screen Shot 2013-08-22 at 7.41.14 PM

This set also had students immediately recognizing that 5000 was an outlier. We had a fascinating discussion when some students said that out of the set {2,2,3,4,8}, 8 should be considered an outlier. It led us to demand a better definition for outlier than ‘I know it when I see it’. This will come soon enough.

The game was also a fun way to introduce sets with the tenth graders by looking at the characteristics of a single set of responses. Less directly related to the goal of the unit, but a compelling way to get students interacting with each other through numbers. Students that haven’t tended to speak out in the first days of class were on the receiving end of class-wide cheers when they won – an easy channel for low pressure positive attention.

As you might also expect, students quickly figured out how to game the game. Some gave themselves entertaining names. Others figured out that they could enter multiple times, so they did, though still putting in their name each time. Some entered decimals which the program rounded to integers. All of these can be handled by code, but I’m happy with how things worked out as is.

If you want instructions on running this locally for your classroom, let me know. It won’t be too hard to set up.

Day 1 in Physics – Models vs. Explanations

One of my goals has always been to differentiate my job from that of a paid explainer. Good teaching is not explaining exclusively – though it can be part of the process. This is why many people seek a great video or activity that thoroughly explains a concept that puzzles them. The process of learning should be an interactive one. An explanation should lead into another question, or an activity that applies the concept.

For the past two years, I’ve done a demo activity to open my physics class that emphasizes the subtle difference between a mental model for a phenomenon and having just a good explanation for it. A mental model makes predictions and is therefore testable. An explanation is the end of a story.

The demo equipment involves a cylindrical neodymium magnet and an aluminum tube of diameter slightly larger than the magnet. It is the standard eddy current/Lenz’s law/electromagnetic induction demo showing what happens when a magnet is dropped into a tube that is of a non-magnetic material. What I think I’ve been successful at doing is converting the demo into an experience that opens the course with the creation of a mental model and simultaneous testing of that model.

IMG_1016

I walk into the back of the classroom with the tube and the magnet (though I don’t tell them that it is one) and climb on top of a table. I stand with the tube above the desk and drop the magnet concentrically into the tube.

Students watch what happens. I ask for them to share their observations. A paraphrased sample:

  • The thing fell through the tube slowly than it should have
  • It’s magnetic and is slowing down because it sticks to the side
  • There’s so much air in the tube that it slows down the falling object.

I could explain that one of them is correct. I don’t. I first ask them to turn their observation into an assertion that should then be testable by some experiment. ‘The object is a magnet’ becomes ‘if the object is a magnet, then it should stick to something made out of steel.’ This is then an experiment we can do, and quickly.

When the magnet sticks strongly to the desk, or paper clips, or that something else happens that establishes that the object is magnetic, we can further develop our mental model for what is happening. Since the magnet sticks to steel, and the magnet seems to slow down when it falls, the tube must be made of some magnetic metal. How do we test this? See if the magnet sticks to the tube. The fact that it doesn’t stick as it did to the steel means that our model is incomplete.

Students then typically abandon the magnet line of reasoning and go for air resistance. If they went for this first (as has happened before) I just reverse the order of these experiments with the above magnetic discussion. If the object is falling slowly, it must be because the air is slowing it down. How do we test this? From the students: drop another object that is the same size as the first and see if it falls at the same speed. I have a few different objects that I’ve used for this – usually an aluminum plug or part from the robotics kit works – but the students also insist on taping up the holes that these objects have so that it is as close to the original object as possible. It doesn’t fall at the same speed though. When students ask to add mass to the object, I oblige with whatever materials I have on hand. No change.

The mental model is still incomplete.

We’ve tried changing the object – what about the tube? Assertion from the students: if the material for the tube matters, then the object should fall at a different speed with a plastic tube. We try the experiment with a PVC pipe and see that the magnet speeds along quite unlike it did in the aluminum tube. This confirms our assertion – this is moving us somewhere, though it isn’t clear quite where yet.

Students also suggest that friction is involved – this can still be pushed along with the assertion-experiment process. What would you expect to observe if friction is a factor? Students will say they should hear it scraping along or see it in contact with the edges of the tube. I invited a student to stare down the end of the tube as I dropped the magnet. He was noticeably excited by seeing it hover lightly down the entire length of the tube, only touching its edges periodically.

Students this year asked to change the metal itself, but I unfortunately didn’t have a copper tube on hand. That would have been awesome if I had. They asked if it would be different if the tube was a different shape. Instead of telling them, I asked them what observation they would expect to make if the tube shape mattered. After they made their assertion, I dropped the magnet into a square tube, and the result was very similar to with the circular tube.

All of these experiments make clear that the facts that (a) the object is a magnet and (b) the tube is made of metal are somehow related. I did at this point say that this was a result of a phenomenon called electromagnetic induction. For the first time during the class, I saw eyes glaze over. I wish I hadn’t gone there. I should have just said that we will eventually develop some more insight into why this might happen, but for now, let’s be happy that we’ve developed some understanding of what factors are involved.

All of these opportunities to get students making assertions and then testing them is the scientific method as we normally teach it. The process is a lot less formal than having them write a formal hypothesis, procedure, and conclusion in a lab report – appropriate given that it was the first day of the class – and it makes clear the concept of science as an iterative process. It isn’t a straight line from a question to an answer, it is a cyclical process that very often gets hidden when we emphasize the formality of the scientific method in the form of a written lab report. Yes, scientists do publish their findings, but this isn’t necessarily what gets them up in the morning.

Some other thoughts:

  • This process emphasizes the value of an experiment either refuting or supporting our hypothesis. There is a consequence to a mental model when an experiment shows what we expected it to show. It’s equally instructive when it doesn’t.I asked the students how many times we were wrong in our exploration of the demo. They counted more than five or six. How often do we provide opportunities for students to see how failure is helpful? We say it. Do we show how?
  • I finally get why some science museums drive me nuts. At their worst, they are nothing more than clusters of express buses from observation/experiment to explanation. Press the button/lift the flap/open the window/ask the explainer, get the answer. If there’s not another step to the exhibit that involves an application of what was learned, an exhibit runs the risk of continuing to perpetuate science as a box of answers you don’t know. I’m not saying there isn’t value in tossing a bunch of interesting experiences at visitors and knowing that only some stuff will stick. I just think there should be a low floor AND a high ceiling for the activities at a good museum.
  • Mental models must be predictive within the realm in which they are used. If you give students a model for intangible phenomena – the lock and key model for enzymes in biology for example – that model should be robust enough to have students make assertions and predictions based on their conception of the model, and test them. The lock and key model works well to explain why enzymes can lose effectiveness under high temperature because the shape of the active site changing (real world) matches our conception of a key being of the wrong shape (model). Whenever possible, we should expose students to places where the model breaks down, if for no other reason, to show that it can. By definition, it is an incomplete representation of the universe.

Standards Based Grading & Unit Tests

I am gearing up for another year, and am sitting in my new classroom deciding the little details that need to be figured out now that it is the “later” that I knew would come eventually. Last year was the first time I used SBG to assess my students. One year in, I understand things much better than when I first introduced the concept to my students. By the end of the year, they were pretty enthusiastic about the system and appreciated that I had made the change.

I wonder now about the role of unit tests. Students did not get an individual grade for a test at the end of a unit – instead just a series of adjustments to their proficiency levels for the different standards of the related unit, and other units if there were questions that assessed them. While there were times for students to reassess during class and before and after school, a full period devoted to this purpose helped in a few unique ways that I really appreciate:

  • All students reassessing at the same time means no issues with scheduling time for retakes.
  • Students that have already demonstrated their ability to work independently to apply content standards are given an opportunity to do so in the context of all of the standards of the unit. They need to decide which standards apply in a given situation, which is a higher level rung of cognitive demand. This is why students that perform well on a unit exam usually move up to a 4 or 5 for the related standards.
  • Students that miss a full period assessment due to illness, school trips, etc. know that they must find another time to assess on the standards in order to raise their mastery level. It changes the conversation from ‘you missed the test, so here’s a zero’ to ‘you missed an opportunity to raise your mastery level, so your mastery levels are staying right where they are while we move on to new topics.’

I also like the unintended connection to the software term unit testing in which the different components of a piece of software are checked to see that they function independently and in concert with each other. This is what we are interested in seeing through reassessment, no?

My question to the blogosphere is to fill in the holes of my understanding here. What are the other reasons to have unit exams? Or should I get rid of them altogether and just have more scheduled extended times to reassess consistently, regardless of progress throughout the content of the semester?

Exponent rules and Witchcraft

I just received this email from a student:

I FINALLY UNDERSTAND YOUR WITCHCRAFT OF WHY 3 TO THE POWER OF 0 IS ONE.

3^0 = 3^(1 + -1) = (3^1)*(3^-1) = 3 * (1/3)

Talk about an accomplished summer.

This group in Algebra 2 took a lot of convincing. I went through about four or five different approaches to proving this. They objected to using laws of exponents since 30 is one of the rules of exponents. They didn’t like writing out factors and dividing them out. They didn’t like following patterns. While they did accept that they could use the exponent rule as fact, they didn’t like doing this. I really liked that they pushed me so far on this, and I don’t entirely believe that their disbelief was simply a method of delaying the lesson of the day.

Whatever it was that led this particular student to have such a revelation, it makes me incredibly proud that this student chose to follow that lead, especially given that it is the middle of summer vacation. Despite labeling the content of the course ‘witchcraft’, I’m marking this down in the ‘win’ column.

Half Full Activity – Results and Debrief

Screen Shot 2013-07-10 at 7.07.48 AM

If you haven’t yet participated, visit http://apps.evanweinberg.org/halffull/ and see what it’s all about. If I’ve ever written a post that has a spoiler, it’s this one.

First, the background.

“A great application of fractions is in cooking.”

At a presentation I gave a few months ago, I polled the group for applications of fractions. As I expected, cooking came up. I had coyly included this on the next slide because I knew it would be mentioned, and because I wanted the opportunity to call BS.

While it is true that cooking is probably the most common activity where people see fractions, the operations people learn in school are never really used in that context. In a math textbook, using fractions looks like this:

Screen Shot 2013-07-10 at 7.15.13 AM

In the kitchen, it looks more like this:
IMG_0571

A recipe calls for half of a cup of flour, but you only have a 1 cup measure, and to be annoying, let’s say a 1/4 cup as well. Is it likely that a person will actually fill up two 1/4 cups with flour to measure it out exactly? It’s certainly possible. I would bet that in an effort to save time (and avoid the stress that is common to having to recall math from grade school) most people would just fill up the measuring cup halfway. This is a triumph of one’s intuition to the benefits associated with using a more mathematical methods. In all likelihood, the recipe will turn out just fine.

As I argued in a previous post, this is why most people say they haven’t needed the math they learned in school in the real world. Intuition and experience serve much better (in their eyes) than the tools they learned to use.

My counterargument is that while relying on human intuition might be easy, intuition can also be wrong. The mathematical tools help provide answers in situations where that intuition might be off and allows the error of intuition to be quantified. The first step is showing how close one’s intuition is to the correct answer, and how a large group of people might share that incorrect intuition.

Thus, the idea for half full was born.

The results after 791 submissions: (Links to the graphs on my new fave plot.ly are at the bottom of the post.)

Rectangle

Screen Shot 2013-07-10 at 7.42.14 AM
Mean = 50.07, Standard Deviation = 8.049

Trapezoid

Screen Shot 2013-07-10 at 7.47.10 AM
Mean = 42.30, Standard Deviation = 9.967

Triangle

Screen Shot 2013-07-10 at 7.50.55 AM
Mean = 48.48, Standard Deviation = 14.90

Parabola

Screen Shot 2013-07-10 at 7.55.34 AM
Mean = 51.16, Standard Deviation = 16.93

First impressions:

  • With the exception of the trapezoid, the mean is right on the money. Seems to be a good example of wisdom of the crowd in action.
  • As expected, people were pretty good at estimating the middle of a rectangle. The consistency (standard deviation) was about the same between the rectangle and the trapezoid, though most people pegged the half-way mark lower than it actually was on the trapezoid. This variation increased with the parabola.
  • Some people clicked through all four without changing anything, thus the group of white lines close to the left end in each set of results. Slackers.
  • Some people clearly went to the pages with the percentage shown, found the correct location, and then resubmitted their answers. I know this both because I have seen the raw data and know the answers, and because there is a peak in the trapezoid results where a calculation error incorrectly read ‘50%’.

    I find this simultaneously hilarious, adorable, and enlightening as to the engagement level of the activity.

Second Impressions

  • As expected, people are pretty good at estimating percentage when the cross section is uniform. This changes quickly when the cross section is not uniform, and even more quickly when a curve is involved. Let’s look at that measuring cup again:
    IMG_0571

    In a cooking context, being off doesn’t matter that much with an experienced cook, who is able to get everything to balance out in the end. My grandmother rarely used any measuring tools, much to the dismay of anyone trying to learn a recipe from her purely from observing her in the kitchen. The variation inherent in doing this might be what it means to cook with love.

  • My dad mentioned the idea of providing a score and a scoreboard for each person participating. I like the idea, and thought about it before making this public, but decided not to do so for two reasons. One, I was excited about this and wanted to get it out. Two, I knew there would probably be some gaming the system based on resubmitting answers. This could have been prevented through programming, but again, it wasn’t my priority.
  • Jared (@jaredcosulich) suggested showing the percentage before submitting and moving on to the next shape. This would be cool, and might be something I can change in a later revision. I wanted to get all four numbers submitted for each user before showing how close that user was in each case.
  • Anyone who wants to do further analysis can check out the raw data in the link below. Something to think about : The first 550 entries or so were from my announcement on Twitter. At that point, I also let the cat out of the bag on Facebook. It would be interesting to see if there are any data differences between what is likely a math teacher community (Twitter) and a more general population.

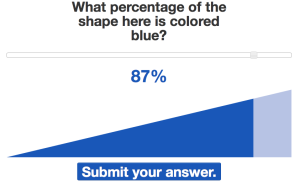
This activity (along with the Do You Know Blue) along with the amazing work that Dave Major has done, suggests a three act structure that builds on Dan Meyer’s original three act sequence. It starts with the same basic premise of Act 1 – a simple, engaging, and non-threatening activity that gets students to make a guess. The new part (1B?) is a phase that allows the student to play with that guess and get feedback on how it relates to the system/situation/problem. The student can get some intuition on the problem or situation by playing with it (a la color swatches in Do You Know Blue or the second part of Half Full). This act is also inherently social in that students easily share and see the work of other students real time.

The final part of this Act 1 is the posing of a problem that now twists things around. For Half Full, it was this:
Screen Shot 2013-07-10 at 8.37.30 AM

Now that the students are invested (if the task is sufficiently engaging) and have some intuition (without the formalism and abstraction baggage that comes with mathematical tools in school), this problem has a bit more meaning. It’s like a second Act 1 but contained within the original problem. It allows for a drier or more abstract original problem with the intuition and experience acting as a scaffold to help the student along.

This deserves a separate post to really figure out how this might work. It’s clear that this is a strength of the digital medium that cannot be efficiently done without technology.

I also realize that I haven’t talked at all about that final page in my activity and the data – that will come later.

A big thank you to Dan Meyer for his notes in helping improve the UI and UX for the whole activity, and to Dave Major for his experience and advice in translating Dan’s suggestions into code.


Handouts:

Graphs

The histograms were all made using plot.ly. If you haven’t played around with this yet, you need to do so right away.

Rectangle: https://plot.ly/~emwdx/10

Trapezoid: https://plot.ly/~emwdx/11

Triangle: https://plot.ly/~emwdx/13

Parabola: https://plot.ly/~emwdx/8

Raw Data for the results presented can be found at this Google Spreadsheet.

Technical Details

  • Server side stuff done using the Bottle Framework.
  • Client side done using Javascript, jQuery, jQueryUI, Raphael for graphics, and JSONP.
  • I learned a lot of the mechanics of getting data through JSONP from Chapter 6 of Head First HTML5 Programming. If you want to learn how to make this type of tool for yourself, I really like the style of the Head First series.
  • Hosting for the app is through WebFaction.
  • Code for the activity can be found here at Github.

Visiting the Museum of Math in NYC

I was reminded by John Burk that the Museum of Math had been opened since I was last in New York. A good friend was in town on a weekend getaway from summer coursework in preparation for starting teaching math this fall. It was the perfect motivation to make time for visiting the museum sooner rather than later.

IMG_0759

IMG_0760

IMG_0763

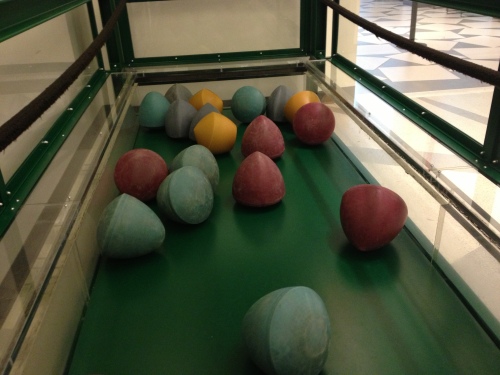
I was really impressed with the museum when I first walked in. The message that mathematics can be a language of play and exploration is emphasized from the experiential exhibits on the top floor. From pulling a cart that rolled across various solids to working to tesselate a hyperbolic surface with polygons, there is lots to touch, pull, and do to play with mathematical concepts. Without a doubt, these activities “stimulate inquiry, spark curiosity, and reveal the wonders of mathematics” as the mission statement aspires to do. The general organizing idea of the activities on the top floor is to provide a really interesting, perplexing object or concept to play with, and then dip into the mathematics surrounding that play for those that are interested. One could miss the kiosks that explain the underlying concepts and still feel satisfied with the overall experience.

IMG_0766

The museum had a good mix of activities from different fields of mathematics. Most exhibits were built around a visually defined task that required little explanation in order to start playing with it and understanding its rules through that play. For me, the activities with the largest initial investment/perplexity ratio were the line of lasers that made it possible to see the cross section of a shape and the wall that generates a fractal tree from images of you and a neighbor. Building objects that roll along a particular path was also incredibly engaging for me.

The challenge for a museum like this is to be intriguing without being tricky or elitist. Given that many people experience anxiety about mathematics for all sorts of reasons, I am absolutely sure that the museum’s exhibit designers worked extremely hard to make the bar for entry for these activities as low as possible with a high ceiling. To this end, I think the museum has done a fabulous job. Most exhibits make clear what they are all about and give visible feedback on a visitor’s progress toward reaching the goal. The only area for growth that jumped out at me was an expansion of the role of the staff circulating among the exhibits. They were extremely knowledgeable of the content of the exhibits and were really excited to share what they knew about them. Even as someone that enjoys mathematics, however, there were some exhibits that left me wondering whether I was playing with it correctly. I saw the Shape Ranger exhibit as a puzzle to figure out, for example. I could see others leaving it when the activity didn’t clearly define visually what the score of the activity represented. I envision an expanded role of staff members helping nudge visitors to understand the premises of the more abstract exhibits through careful questioning and good examples of how to play.

This was not a deal breaker for me, however, and didn’t seem to be for the crowd of people in attendance. The number of smiling kids and adults enjoying themselves is clearly the best indication that the museum is doing a great job of fulfilling its mission. This museum has the same sort of open-ended atmosphere that the Exploratorium in San Francisco creates for its visitors, and that puts it in very respectable company.

#MakeoverMonday – Sun Room Carpet

This is my attempt to revise the textbook problem Dan Meyer posted here:

The task:
130626_1

What I did:

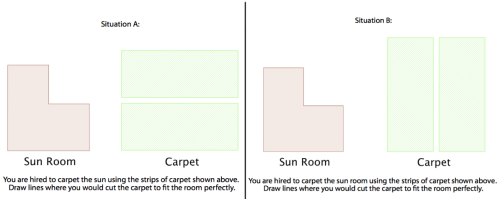
  • Bring the most interesting part of the problem (to me) to the front of the task. The idea of requiring the seams to go in the same direction with a minimum number of seams is the only opening for multiple answers in this problem. Start with this, and the students will already have a chance to disagree about answers, which we know is a good way to get conversations going.
  • Frame this possibility of multiple arrangements visually, not with text. By placing the carpet strips in different configurations when first displaying the task, I’m nudging students toward different answers. Again, this conflict is important to spicing up a pretty plain textbook task.
  • Get rid of those mixed metric/English units immediately. There is no reason that a person would measure the room in meters and then deal with a store that sells in feet and yards. There’s enough here to keep things interesting without dealing with meters and yards.
  • Leave out unnecessary vocabulary like ‘bolt’ and ‘seam’. One more move to reduce the text overload of the problem.

Here’s the rundown of the lesson:

Hand out slips of paper with either Situation A or Situation B shown below.

Screen Shot 2013-06-28 at 8.15.29 AM

Once students have drawn their lines, share a few of the drawings to show the differences. Pose the question: Which situation (A or B) will require more cutting?

Have students make and record their guesses.

Move to the second act here. What information would you need to answer the question precisely?

There’s some wiggle room here for what happens next. If the students ask for the measurements, you could give them this diagram:
Screen Shot 2013-06-28 at 8.21.26 AM

In reality though, students could figure this out just by making measurements with a ruler on the diagram. No big deal either way.

We then ratchet up the task by bringing up the tape factor:
Screen Shot 2013-06-28 at 8.27.26 AM

The students might not realize that the carpet is attached at the edges of the room (though not usually with tape) which is why it’s important to bring up this point. At this point the dimensions diagram still might be requested, but it isn’t really necessary until students start reporting their answers. What units are involved?

It would be at this stage when I would actually ask the students which situation is the better option for carpeting the room. The ambiguity is on purpose – students need to decide what it really means for a situation to be better. Is it cost? Time required to cut? Amount of tape? All of these factors come into play. The original problem ultimately asks what the total cost is for the carpet and the tape, but there are lots of possibilities for what can be done at this point in the lesson. Here are some possibilities:

At the hardware store, you learn the following:

  • A 30 foot roll of double sided tape costs $4.85
  • The carpet sells for $22.95 per square yard
  • What is the minimum cost to carpet the room?

Or, building on that information:

Suppose you also make $11.50 per hour to lay carpet.

Which situation do you choose to maximize the money you make on the job? What information would you need to answer this question?

Having students work to answer this efficiently means getting students that have worked on the two situations to talk to each other.

Follow up questions to throw in:

  • If you had a choice of 3, 5, or 12 foot wide strips of carpet, which would result in the cheapest overall job
  • If you can cut the carpet at 2.5 inches/second for a straight cut, with an additional second for each cut, how long would it take for you to prep the carpet for the room?

This is my first attempt in the Make over Monday series, and I’m exhausted. Also, this was fun. What’s next, Dan?

Tea with Lee Magpili and the LEGO Mindstorms EV3

Though my schedule being back in the US this summer has been busy, when I learned that Lee Magpili was going to be in town, I cleared my schedule. I first met Lee when I was working with the Bronx FIRST LEGO League initiative several years ago. He was a quiet presence in comparison to the energetic middle school students that attended our workshops to play with LEGO robots, but I quickly learned of his prowess with building with LEGO elements. His rovers navigated the FLL field with ease and used mechanisms that balanced simplicity with effectiveness. Eventually he mentored an FLL team to do exceptionally well. Like all great FLL coaches, however, he insisted on the students doing the work. In our conversations at that time, I quickly understood that Lee believed (and continues to believe) that LEGO is an amazing platform upon which to learn an enormous range of useful skills. Robotics, in particular, capitalizes on the unique blend of play and learning through LEGO to get students to understand the engineering design process. Lee is a believer in the potential for students to be quickly engaged and motivated to work hard when the right tools are around.

It was consequently no surprise when I learned Lee had been selected for a job with LEGO education in Denmark a couple of years ago. He and I wrote back and forth periodically about the position and what it entailed, but for a while our conversations turned noticeably away from the details of his work. I figured this was just a consequence of the distance and I left it at that.

This ended last January with the announcement of the LEGO Mindstorms EV3. When Lee posted a link to the announcement on Facebook, I suddenly understood. It made me realize that like any good designer, he kept his ideas secret until they were ready to share with the world. (I assume a pretty airtight NDA was also involved.)

Lee sat down with me at Saints Alp Teahouse in New York for some bubble tea, snacks, and conversation about the EV3. What struck me was that Lee’s enthusiasm for using LEGO as a learning tool hasn’t just been maintained, it has grown considerably since becoming part of the EV3 team. As you might also expect, he was excited to show me the bits and pieces of the kit that will be coming out in August.

20130627-075548.jpg

From a LEGO designer’s perspective, the attention to detail in acknowledging the desires of the LEGO fan community and the limitations of the NXT set will most definitely be appreciated. There are some subtle changes that made me excited given my own experiences building with the curves of the NXT and its parts.

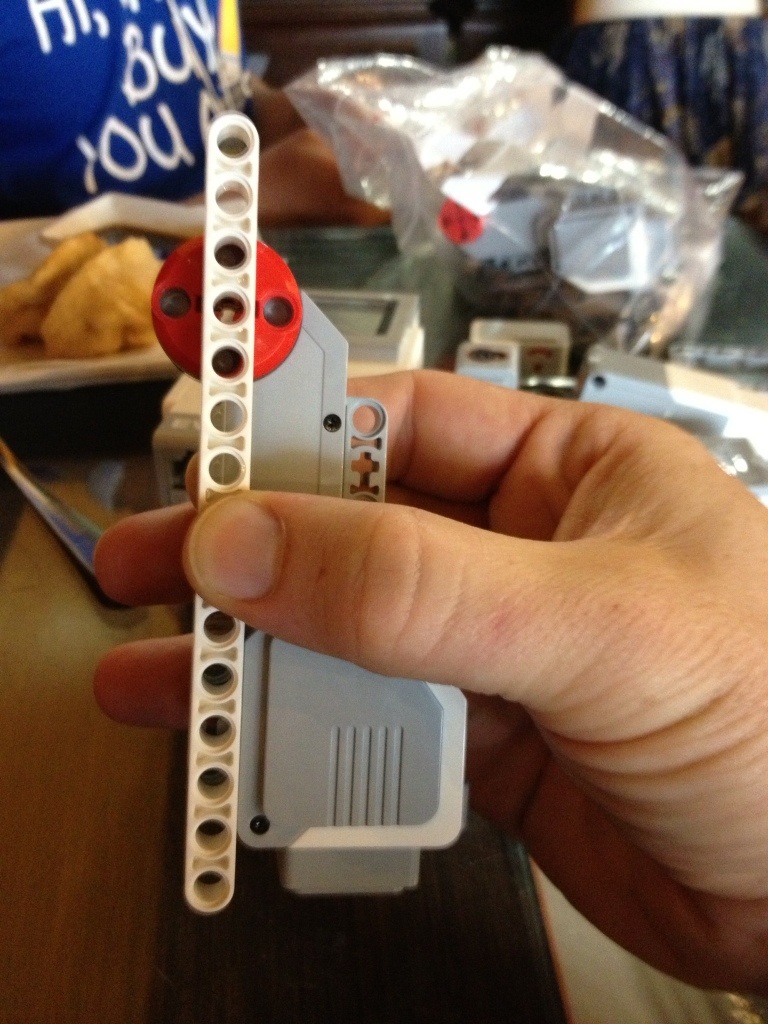
For example, a reshaping of the motor has made it much easier to attach pins and secure it to designs:

20130627-075218.jpg

Sensors can be attached using a single pin if needed:

20130627-075029.jpg

I also suspect that many people will discover ways that alignment between different components will be much easier with the new set:

20130627-075319.jpg

Lee also spoke a lot about the care that he and the team have taken to make the bar for entry with the kit low, and the ceiling high. The education kit will include instructions for building modules that can be used in different designs. A conveyor belt doubles as a set of tracks. A motor-wheel module can be built that is sturdy but easy to build upon. This will help students (and teachers) minimize the frustration that inevitably occurs when straying from build instructions to pursue an idea for a new design. The strengths associated with building with Technics parts will be a lot more intuitive to newcomers that may have only worked with bricks.

I am excited to get my hands on one of these kits. In my robotics class this year, students grew considerably in their ability to conjure up a design and make it happen with the bricks. Students often got frustrated by the curves of the NXT motors getting in the way of their designs. The ease of attaching motors directly to the programmable brick of the EV3 will make it even easier to get students learning programming techniques. The on brick features for prototyping and programming will make things much easier for trying out quick ideas, especially on an FLL field.

It was good catching up with Lee – he is a person to watch in the world of LEGO Education. He was at the FIRST World Festival to demonstrate the EV3 to FIRST LEGO League teams, not to mention members of the Board of Directors at the LEGO group. He told me that his plans include photographing Gyro Boy in Times Square and Washington Square Park. Though he assures me that the robot named ‘Evan’ that has been touring the world to demonstrate the EV3 is not named after me, I’m going to continue to assume that it is.

1 17 18 19 20 21 32