Ultrasonic Sensors & Graph Matching: Play, then learn

In my physics class this morning, the plan was to have students work through a packet of descriptions of constant velocity motion. Each description was either a position vs. time graph, a velocity vs. time graph, or a motion map. Students would then sketch the corresponding velocity/position graphs, and then actually act out these scenarios in front of an ultrasonic detector. With a live graph showing them what their position vs. time graphs were as they moved, mayhem invariably would result.

I had a last minute change to my plan this morning. Following the ideal set out by one of my favorite books as a kid and my favorite museum (the Exploratorium), I asked ‘how can we play with this?’

I had the sensor ready to go at the start of class. I told a student to walk back and forth in front of it while data was collected. I didn’t have to give any other instruction – they saw how their movement resulted in a graph.

I then put two post-it notes on the screen and told another student to make the graph hit them both:

Screen Shot 2014-09-03 at 5.46.41 PM

This was probably the first time since the first day of school that the class was all smiles.

After they had this figured out, I gave them another task: hit the post-it notes, but also make the graph go along a string taped to the wall:

Screen Shot 2014-09-03 at 5.49.15 PM

This took a bit more time for developing intuition, but they got this down.

It was only at this point when I introduced the packet of scenarios. They went right to work and sped their way through, helping each other when differences arose.

My usual assessment activity for this has always been that I could call each student up to generate a specific graph. Since they don’t know who I’m going to call until the last minute, they ideally would work to understand how to generate each graph in front of the detector so that they were ready in case I called them up.

A student this morning said point blank that this plan did not sound fun at all. When I thought about it a bit more, I realized it was a fear based activity. The student instead suggested that I call each of them up, and give a number for a graph that needed to be generated, and the rest of the class could guess which one it was.

Clearly a superior idea. We proceeded to run the activity this way, and it was a blast.

I’m not sure why I haven’t done this activity this way in the past. It’s obviously superior to almost anything else for a number of reasons.

  • The activity starts with no numbers, just intuition and feedback. It’s fun seeing your own movement be simultaneously measured and displayed in front of you. The need to communicate about the process is where the vocabulary and numerical measurement comes in – that’s a perfect place for a teacher to step in once students are digging the activity.
  • The idea of setting an origin and detailing the meaning for increasing or decreasing position values isn’t necessary here. Students figure out quickly how these relate to their own movement without any intervention on my part.
  • Any activity that gets teenagers out of their seats and moving around during the first block of the day (and does so in a way that also directly serves the learning goals of a lesson) is going to be vastly superior to pretty much everything.

A great way to open a rainy Wednesday in Hangzhou, by any measure.

Graduated Assessment & Web Design

I decided to try teaching programming this year as a class, specifically HTML, CSS, and Javascript. My hope is to get students to the point that they can put together a basic Meteor app by the end of the year, along with a good set of skills for building web pages from scratch.

My assessment scheme for the class is through a series of projects. Some are small, some are bigger and more open ended. I noticed during class on Tuesday that students are cutting corners by copying HTML from files we used in earlier classes. I admittedly do this all the time, but I pay the price for doing so in time spent cleaning up fragments of code that I really could have written from scratch in less time. In the general series of trying to teach good habits, I decided to give a graduated assignment that went through the series of HTML concepts we have learned over the past two weeks.

The requirement is that students need to make one HTML file for each of the ten steps in this file. They have to start from a blank HTML template that has nothing more than the basic head and body elements. I also had students write out the code for the first three steps by hand.

Screen Shot 2014-08-28 at 7.44.02 PM

The effect today in class was a clear measurement of where each student stands in understanding how to piece together HTML from scratch. I collected the folders of files from students at the end of class and can see precisely where their difficulties are. Some of this comes from just knowing what step they were on at the end of class, but I also had some good conversations with students throughout the period today. My class, thankfully, was pretty honest in showing what they do and don’t understand how to do. While there has been some code sharing in the class before, they seemed to appreciate this opportunity to step their way through the progression of what we’ve learned so far.

I think there’s an analogue in math and science here – I’ve given leveled practice sheets before in various mathematics topics. The willingness to push through misunderstanding and admit difficulties seems to be a lot more substantial in a programming context.

Here’s the full exercise:
day5-Step Instructions

Ratios & Proportions – Day One Antics

Yesterday was our first day into a unit on similarity with the ninth grade students.

The issue that comes up every year is that students like to cross multiply, but are incredibly mechanical in their understanding of why they do so. They don’t like fractions that aren’t simplified, and can usually simplify them well. They bring up the fact that multiplication of numerator and denominator by the same number is equivalent to multiplying by one. They seem to have very little understanding of how this relates to units and unit conversions as well.

I changed my approach this year to be much less review of how to solve proportions. I wanted to get at the aspects of measurement that are inherent to math problems involving similarity. I wanted to get them to ask themselves a bit more about why they took the steps they took in solving proportions in the process.

I started with a couple simple problems in the warm-up. Here was one:
Screen Shot 2014-03-08 at 2.16.05 PM

I took pictures of two students’ work, put them side by side, and asked the class which one they thought was a better answer to the question:
Screen Shot 2014-03-08 at 2.17.40 PM

The resulting vote and conversation was especially spirited, particularly for a class that normally rejects whole class discussion. We talked about the ideas of approximate and exact answers, a couple of students pointing out that substitution of the approximate answers would result in a false statement in the equation.

After this, I showed them another picture and asked if the LEGO pieces in this picture would go together:
Screen Shot 2014-03-08 at 2.30.59 PM

Every hand went up.

I then showed them the bricks, which I had made on our school’s new 3D printer:
Screen Shot 2014-03-08 at 2.33.47 PM

Pause for groans. Some key things were said in response to my ‘playing dumb’ question of why the two bricks won’t fit together. One student even directly said that they looked similar to each other, but that they weren’t the same size. I wanted them to have in the back of the heads that I was going to be pushing them to always think about figure with the same shape, different size.

We then made it to the second task of the warm-up activity. I asked them to estimate (and subsequently measure) the ratio of one of my heads in this image to the next:
Screen Shot 2014-03-08 at 2.45.32 PM

I developed the following points:

  • When communicating ratios to another person, begin explicit and clear about order is extremely important.
  • Despite the different units, these ratios are all communicating the same relationship from one head to the next. This relationship is even more obvious when we write the ratio as a fraction instead of using the colon notation.
  • The approximate values of this fraction are all roughly the same. We don’t need to convert units either for this to happen – the units divide themselves out in the fraction.

I went on to define a proportion and reviewed the idea of cross products. They were a bit surprised when I showed them that cross products were equal for equivalent fractions. Part of this was because they saw me equate 2/5 and 4/10 and immediately said they were equal because one simplified into the other. I gave them 2/5 and 354453764/886359410 and they were a bit more willing to see that cross products can be a slicker way to check equality.

One more point that I made was that a proportion with a variable in it was really a question. If we are saying two fractions are equal to each other, and one (or more) of the fractions has a variable, what does that mean about the value of the variable? It led to a bit more conversation about the reasons for cross multiplication as a method of solving proportions, and I was satisfying then leaving students to work through some more review problems on their own.

The final piece we talked about whole group was this open ended question:
Screen Shot 2014-03-08 at 3.02.00 PM

They were able to come up with some, but struggled to make ratios that were more than simple multiples. This was surprising, as their mental calculation skills are generally quite strong. As shown in the example, I gave them one way to see how to come up with an arbitrary set of lengths that fit the requirement.

I then showed them this question:
Screen Shot 2014-03-08 at 3.05.31 PM

Some of the students realized (and explained eloquently) that they could divide the length by 7 and find the length of a single ‘unit’, and then multiple that unit by 3 or 4 to get the length. Explanations for why this worked didn’t really materialize. I introduced the algebraic approach, and students saw it as an explanation, but seemed to be fine with just remembering it as a method rather than as a rationale.

The more that I teach proportions and similarity, the more I feel compelled to have students ground the concepts in measurements. Making measurements, especially by hand, is not something they typically do on a day-to-day basis, so there’s a bit of a novelty factor there. These conversations about measurements, units, and fractions were authentic – there was a need to talk about these ideas in the context I established, and the students did a great job of feeling and then filling that need during the class. Nothing we did was a particularly real world task though. What made this real was my attempts to first frame the skills that we needed to review in the context of a need for those skills. I try to do this often, and I’d like to mark this as a success story.

Intermediate Value Theorem & Elevators

I’ve used the elevator analogy with the intermediate value theorem before, but only after talking students through the intermediate value theorem first. This time, I took them through the following thought experiment first:

Step 1:

You enter the elevator on floor 2. You close your eyes and keep them closed until you arrive at floor 12, twenty seconds later.

Questions for discussion:

  • At approximately what time was the elevator located at floor 7? How do you know? What assumptions are you making?
  • Was there a time when the elevator was at floor 3? Floor 8? How do you know?
  • Were you ever at floor 13? How do you know? Are you really sure?

Step 2:

Another day, you again enter the elevator on floor 2. You again keep your eyes closed, but another person gets on from some floor other than floor 2. You keep your eyes closed. The other person leaves the elevator at some point. After 60 seconds, you are on floor 12, and you open your eyes.

Questions:

  • Was there a time at which the elevator was at floor 7? How do you know?
  • Was there a time at which the elevator was at floor 13? How do you know?
  • What was the highest floor at which you can guarantee the elevator was located during the minute long trip? The lowest floor?

Step 3

On yet another day, you are once again entering the elevator at floor 2 to go to floor 12. You close your eyes, same story as before. Another person gets on the elevator and leaves. This time, however, you open your eyes just long enough to see that the person leaves the elevator at floor 15. As before, the entire trip takes 60 seconds.

Questions:

  • Was there a time at which the elevator was at floor 7?
  • Was there a time at which the elevator was at floor 13? How do you know?
  • Make a list of all of the floors that you can guarantee that the elevator could have stopped at during the 60 second trip.
  • Can you guarantee that the elevator was never located at floor 17?

We then visited the driving principle to why we can do this thought experiment: why can we come to these conclusions without opening our eyes in the elevator? What is it about our experiences in elevators that makes this possible?

My students were primed to bring up continuity given that they worked through the concepts during the previous class. That said, there were quite a few lights that went on when I asked what it would be like to ride in a discontinuous elevator. Skipping floors, feeling the elevator move upwards and then arriving at a floor lower than where we started, or arriving at different floors just from closing or opening the doors.

Once we were comfortable with this, I threw the standard vocabulary of the intermediate value theorem:

Suppose f(x) has a maximum value M and a minimum value L over an interval [a,b]. There exists a value c in [a,b] such that L≤f(c)≤M as long as…

…and I left it there, hanging in the air until a student filled the silence with the condition of continuity over [a,b]. This was also a great time to introduce the idea of an existence theorem – it tells you that a mathematical object exists, and might give you some information on where to find it, but won’t definitively tell you exactly where it is located. Fun stuff.

We then talked about other examples of functions that are or are not continuous. Students brought up crashing into a wall after moving at a non-zero velocity. I also have this group of students the following period for physics, so I brought up what the velocity versus time graph actually looks at when you zoom in to the time of impact. (I like that this wasn’t a cognitive stretch for them given their experience zooming in on data on their calculators and graphs from Logger Pro.) The student that brought this up quickly argued himself back from saying that this was truly discontinuous.

This was a fun activity, and I’m glad I went through it. The concept of IVT is fairly intuitive, but we often present it in a way that doesn’t emphasize why it is special. In previous years, I started with the graph of a polynomial function bouncing up and down, asked students for the max/minimum value, and then asked them to identify whether they could do this for any value in the range between the maximum and minimum. They could, but never really saw the point of why that was special. Forcing them to imagine closing their eyes, limiting the information available to them, and then seeing how far they could take that limited knowledge made a difference in how this felt on the teaching end. I’ve seen some pretty good responses on my assessments of this concept as well, so it seems to have done some good for the students as well. (Phew!)

Math Caching and Immediately Useful Teaching Data

Last July, I posted a video in which I showed how to create a local, customized version of the Math Caching activity that can be found here.

I was inspired to revisit the idea last weekend reading Dan Meyer’s post about teacher dashboards. The part that got me thinking, and that stoked the fire that has been going in my head for a while, is identifying the information that is most useful to teachers. There are common errors that an experienced teacher knows to expect, but a new teacher may not recognize is common until it is too late. Getting a measure of wrong answers, and more importantly, the origin of those wrong answers, is where we ideally should be making the most of the technology in our (and the students’) hands. Anything that streamlines the process of getting a teacher to see the details of what students are doing incorrectly (and not just that they are getting something wrong) is valuable. The only way I get this information is by looking at student work. I need to get my hands on student responses as quickly as I can to make sense of what they are thinking.

As we were closing in on the end of an algebra review unit with the ninth graders this week, I realized that the math cache concept was good and fun and at a minimum was a remastering of the review sheet for a one-to-one laptop classroom. I came up with a number of questions and loaded it into the Python program. When one of my Calculus students stopped in to chat, and I showed her what I had put together, I told her that I was thinking of adding a step where students had to upload a screenshot of their written work in addition to entering their answer into the location box. She stared at me and said blankly: ‘You absolutely have to do that. They’ll cheat otherwise.’

Screen Shot 2013-09-20 at 11.23.26 PM

While I was a bit more optimistic, I’m glad that I took the extra time to add an upload button on the page. I configured the program so that each image that was uploaded was also labeled with the answer that the student entered into the box. This way, given that I knew what the correct answers were, I knew which images I might want to look at to know what students were getting wrong.

This was pure gold.

Screen Shot 2013-09-20 at 11.30.23 PM

Material like this was quickly filling up the image directory, and I watched it happening. I immediately knew which students I needed to have a conversation with. The answers ranged from ‘no solution’ to ‘identity’ to ‘x = 0’ and I instantly had material to start a conversation with the class. Furthermore, I didn’t need to throw out the tragically predictable ‘who wants to share their work’ to a class of students that don’t tend to want to share for all sorts of valid reasons. I didn’t have to cold call a student to reluctantly show what he or she did for the problem. I had their work and could hand pick what I wanted to share with the class while maintaining their anonymity. We could quickly look at multiple students’ work and talk about the positive aspects of each one, while highlighting ways to make it even better.

In this problem, we had a fantastic discussion about communicating both reasoning and process:

Screen Shot 2013-09-20 at 11.43.02 PM

The next step that I’d like to make is to have this process of seeing all of the responses be even more transparent. I’d like to see student work popping up in a gallery that I can browse and choose certain responses to share with the class. Another option to pursue is to get students seeing the responses of their peers and offer advice.

Automatic grading certainly makes the job of answering the right/wrong question much easier. Sometimes a student does need to know whether an answer is correct or not. Given all the ways that a student could game the system (some students did discuss using Wolfram Alpha during the activity) the informative part on the teaching and assessment end is seeing the work itself. This is also an easy source of material for discussion with other teachers about student work (such as with Michael Pershan’s Math Mistakes).

I was blown away with how my crude hack to add this feature this morning made the class period a much richer opportunity to get students sharing and talking about their work. Now I’m excited to work on the next iteration of this idea.

Same Skills, Virtual Car: Constant Velocity Particle Model

I had everything in line to start the constant velocity model unit: stop watches, meter sticks, measuring tape. All I had to do was find the set of working battery operated cars that I had used last year. I found one of them right where I left it. Upon finding another one, I remembered that didn’t work last year either, and I hadn’t gotten a replacement. The two other cars were LEGO robot cars that I had built specifically for this task, and all I would need would be to build those cars, program them to run their motors forward, and I was ready to go.

Then I remembered that my computer had been swapped for a new model over the summer, so my old LEGO programming applications were gone. Install software nowhere to be found, I went to the next option: buying new ones.

I made my way to a couple stores that sold toys and had sold me one of the cars from last year. They only had remote control ones, and I didn’t want to add the variable of taping the controllers to the on position so they would run forward. Having a bunch of remote control cars in class is a recipe for distraction. In a last ditch effort to try to improve the one working car that I had, I ended up snapping the transmission off of the motor. I needed another option.

John Burk’s post about using some programming in this lab and ending it in a virtual race had me thinking how to address the hole I had dug myself into. I have learned that the challenge of running the Python IDE on a class of laptops in various states of OSX make it tricky to have students use Visual Python or even the regular Python environment.

I have come to embrace the browser as the easiest portal for having students view and manipulate the results of a program for the purposes of modeling. Using Javascript, the Raphael drawing framework, Camtasia, and a bit of hurried coding, I was able to put together the following materials:
Screen Shot 2013-08-25 at 3.19.57 PM
Car 1 Part 1
Car-2-Model-
Constant Velocity model data generator (HTML)

When it came to actually running the class, I asked students to generate a table of time (in seconds) and position data (in meters) for the car from the video. The goal was to be able to figure out when the car would reach the white line. I found the following:

  • Students were using a number of different measuring tools to make their measurements. Some used rulers in centimeters or inches, others created their own ruler in units of car lengths. The fact that they were measuring a virtual car rather than a real one made no difference in terms of the modeling process of deciding what to measure, and then measuring it.
  • Students asked for the length of the car almost immediately. They realized that the scale was important, possibly as a consequence of some of the work we did with units during the preceding class.
  • By the time it came to start generating position data, we had a realization about the difficulty arising from groups lacking a common origin. Students tended to agree on velocity as was expected, but their inability This was especially the case when groups were transitioning to the data from Car 2.
  • Some students saw the benefit of a linear regression immediately when they worked with the constant velocity model data generator. They saw that they could use the information from their regression in the initial values for position, time, and velocity. I didn’t have to say a thing here – they figured it out without requiring a bland introduction to the algebraic model in the beginning.
  • I gave students the freedom to sketch a graph of their work on a whiteboard, on paper, or using Geogebra. Some liked different tools. Our conversation about the details afterwards was the same.

I wish I had working cars for all of the groups, but that’s water under the bridge. I’ve grown to appreciate the flexibility that computer programming has in providing full control over different aspects of a simulation. It would be really easy to generate and assign each group a different virtual car, have them analyze it, and then discuss among themselves who would win in a race. Then I hit play and we watch it happen. This does get away from some of the messiness inherent in real objects that don’t drive straight, or slow down as the batteries die, but I don’t think this is the end of the world when we are getting started. Ignoring that messiness forever would be a problem, but providing a simple atmosphere for starting exploration of modeling as a philosophy doesn’t seem to be a bad way to introduce the concept.

Class-sourcing data generation through games

In my newly restructured first units for ninth and tenth grade math, we tackle sets, functions, and statistics. In the past, teaching these topics have always involved collecting some sort of data relevant to the class – shoe size, birthday, etc. Even though making students part of the data collection has always been part of my plan, it always seems slower and more forced than I want it to be. I think the big (and often incorrect) assumption is that because the data is coming from students, they will find it relevant and enjoyable to collect and analyze.

This summer, I remembered a blog post from Dan Meyer not too long ago describing a brilliantly simple game shared by Nico Rowinsky on Twitter. I had tried this manually with pencil and paper and students since hearing about it. It always required a lot of effort collecting and ordering papers with student guesses, but student enthusiasm for the game usually compelled me to run a couple of rounds before getting tired of it. It screamed for a technology solution.

I spent some time this summer learning some of the features of the Meteor Javascript web framework after a recommendation from Dave Major. It has the real-time update capabilities that make it possible to collect numbers from students and reveal a scoreboard to all users simultaneously. You can see my (imperfect) implementation hosted at http://lownumber.meteor.com, and the code at Github here. Dave was, as always, a patient mentor during the coding process, eagerly sharing his knowledge and code prototypes to help me along.

If you want to start your own game with friends, go to lownumber.meteor.com/config/ and select ‘Start a new game’, then ask people to play. Wherever they are in the world, they will all see the results show up almost instantly when you hit the ‘Show Results’ button on that page. I hosted this locally on my laptop during class so that I could build a database of responses for analysis later by students.

The game was, as expected, a huge hit. The big payoff was the fact that we could quickly play five or six games in my class of twenty-two grade nine students in a matter of minutes and built some perplexity through the question of how one can increase his or her chances of winning. What information would you need to know about the people playing? What tools do we have to look at this data? Here comes statistics, kids.

It also quickly led to a discussion with the class about the use of computers to manage larger sets of data. Only in a school classroom would one calculate measures of central tendency by hand for a set of data that looks like this:
Screen Shot 2013-08-22 at 7.41.14 PM

This set also had students immediately recognizing that 5000 was an outlier. We had a fascinating discussion when some students said that out of the set {2,2,3,4,8}, 8 should be considered an outlier. It led us to demand a better definition for outlier than ‘I know it when I see it’. This will come soon enough.

The game was also a fun way to introduce sets with the tenth graders by looking at the characteristics of a single set of responses. Less directly related to the goal of the unit, but a compelling way to get students interacting with each other through numbers. Students that haven’t tended to speak out in the first days of class were on the receiving end of class-wide cheers when they won – an easy channel for low pressure positive attention.

As you might also expect, students quickly figured out how to game the game. Some gave themselves entertaining names. Others figured out that they could enter multiple times, so they did, though still putting in their name each time. Some entered decimals which the program rounded to integers. All of these can be handled by code, but I’m happy with how things worked out as is.

If you want instructions on running this locally for your classroom, let me know. It won’t be too hard to set up.

Day 1 in Physics – Models vs. Explanations

One of my goals has always been to differentiate my job from that of a paid explainer. Good teaching is not explaining exclusively – though it can be part of the process. This is why many people seek a great video or activity that thoroughly explains a concept that puzzles them. The process of learning should be an interactive one. An explanation should lead into another question, or an activity that applies the concept.

For the past two years, I’ve done a demo activity to open my physics class that emphasizes the subtle difference between a mental model for a phenomenon and having just a good explanation for it. A mental model makes predictions and is therefore testable. An explanation is the end of a story.

The demo equipment involves a cylindrical neodymium magnet and an aluminum tube of diameter slightly larger than the magnet. It is the standard eddy current/Lenz’s law/electromagnetic induction demo showing what happens when a magnet is dropped into a tube that is of a non-magnetic material. What I think I’ve been successful at doing is converting the demo into an experience that opens the course with the creation of a mental model and simultaneous testing of that model.

IMG_1016

I walk into the back of the classroom with the tube and the magnet (though I don’t tell them that it is one) and climb on top of a table. I stand with the tube above the desk and drop the magnet concentrically into the tube.

Students watch what happens. I ask for them to share their observations. A paraphrased sample:

  • The thing fell through the tube slowly than it should have
  • It’s magnetic and is slowing down because it sticks to the side
  • There’s so much air in the tube that it slows down the falling object.

I could explain that one of them is correct. I don’t. I first ask them to turn their observation into an assertion that should then be testable by some experiment. ‘The object is a magnet’ becomes ‘if the object is a magnet, then it should stick to something made out of steel.’ This is then an experiment we can do, and quickly.

When the magnet sticks strongly to the desk, or paper clips, or that something else happens that establishes that the object is magnetic, we can further develop our mental model for what is happening. Since the magnet sticks to steel, and the magnet seems to slow down when it falls, the tube must be made of some magnetic metal. How do we test this? See if the magnet sticks to the tube. The fact that it doesn’t stick as it did to the steel means that our model is incomplete.

Students then typically abandon the magnet line of reasoning and go for air resistance. If they went for this first (as has happened before) I just reverse the order of these experiments with the above magnetic discussion. If the object is falling slowly, it must be because the air is slowing it down. How do we test this? From the students: drop another object that is the same size as the first and see if it falls at the same speed. I have a few different objects that I’ve used for this – usually an aluminum plug or part from the robotics kit works – but the students also insist on taping up the holes that these objects have so that it is as close to the original object as possible. It doesn’t fall at the same speed though. When students ask to add mass to the object, I oblige with whatever materials I have on hand. No change.

The mental model is still incomplete.

We’ve tried changing the object – what about the tube? Assertion from the students: if the material for the tube matters, then the object should fall at a different speed with a plastic tube. We try the experiment with a PVC pipe and see that the magnet speeds along quite unlike it did in the aluminum tube. This confirms our assertion – this is moving us somewhere, though it isn’t clear quite where yet.

Students also suggest that friction is involved – this can still be pushed along with the assertion-experiment process. What would you expect to observe if friction is a factor? Students will say they should hear it scraping along or see it in contact with the edges of the tube. I invited a student to stare down the end of the tube as I dropped the magnet. He was noticeably excited by seeing it hover lightly down the entire length of the tube, only touching its edges periodically.

Students this year asked to change the metal itself, but I unfortunately didn’t have a copper tube on hand. That would have been awesome if I had. They asked if it would be different if the tube was a different shape. Instead of telling them, I asked them what observation they would expect to make if the tube shape mattered. After they made their assertion, I dropped the magnet into a square tube, and the result was very similar to with the circular tube.

All of these experiments make clear that the facts that (a) the object is a magnet and (b) the tube is made of metal are somehow related. I did at this point say that this was a result of a phenomenon called electromagnetic induction. For the first time during the class, I saw eyes glaze over. I wish I hadn’t gone there. I should have just said that we will eventually develop some more insight into why this might happen, but for now, let’s be happy that we’ve developed some understanding of what factors are involved.

All of these opportunities to get students making assertions and then testing them is the scientific method as we normally teach it. The process is a lot less formal than having them write a formal hypothesis, procedure, and conclusion in a lab report – appropriate given that it was the first day of the class – and it makes clear the concept of science as an iterative process. It isn’t a straight line from a question to an answer, it is a cyclical process that very often gets hidden when we emphasize the formality of the scientific method in the form of a written lab report. Yes, scientists do publish their findings, but this isn’t necessarily what gets them up in the morning.

Some other thoughts:

  • This process emphasizes the value of an experiment either refuting or supporting our hypothesis. There is a consequence to a mental model when an experiment shows what we expected it to show. It’s equally instructive when it doesn’t.I asked the students how many times we were wrong in our exploration of the demo. They counted more than five or six. How often do we provide opportunities for students to see how failure is helpful? We say it. Do we show how?
  • I finally get why some science museums drive me nuts. At their worst, they are nothing more than clusters of express buses from observation/experiment to explanation. Press the button/lift the flap/open the window/ask the explainer, get the answer. If there’s not another step to the exhibit that involves an application of what was learned, an exhibit runs the risk of continuing to perpetuate science as a box of answers you don’t know. I’m not saying there isn’t value in tossing a bunch of interesting experiences at visitors and knowing that only some stuff will stick. I just think there should be a low floor AND a high ceiling for the activities at a good museum.
  • Mental models must be predictive within the realm in which they are used. If you give students a model for intangible phenomena – the lock and key model for enzymes in biology for example – that model should be robust enough to have students make assertions and predictions based on their conception of the model, and test them. The lock and key model works well to explain why enzymes can lose effectiveness under high temperature because the shape of the active site changing (real world) matches our conception of a key being of the wrong shape (model). Whenever possible, we should expose students to places where the model breaks down, if for no other reason, to show that it can. By definition, it is an incomplete representation of the universe.

Exponent rules and Witchcraft

I just received this email from a student:

I FINALLY UNDERSTAND YOUR WITCHCRAFT OF WHY 3 TO THE POWER OF 0 IS ONE.

3^0 = 3^(1 + -1) = (3^1)*(3^-1) = 3 * (1/3)

Talk about an accomplished summer.

This group in Algebra 2 took a lot of convincing. I went through about four or five different approaches to proving this. They objected to using laws of exponents since 30 is one of the rules of exponents. They didn’t like writing out factors and dividing them out. They didn’t like following patterns. While they did accept that they could use the exponent rule as fact, they didn’t like doing this. I really liked that they pushed me so far on this, and I don’t entirely believe that their disbelief was simply a method of delaying the lesson of the day.

Whatever it was that led this particular student to have such a revelation, it makes me incredibly proud that this student chose to follow that lead, especially given that it is the middle of summer vacation. Despite labeling the content of the course ‘witchcraft’, I’m marking this down in the ‘win’ column.

Three Acts – Counting with dots and first graders

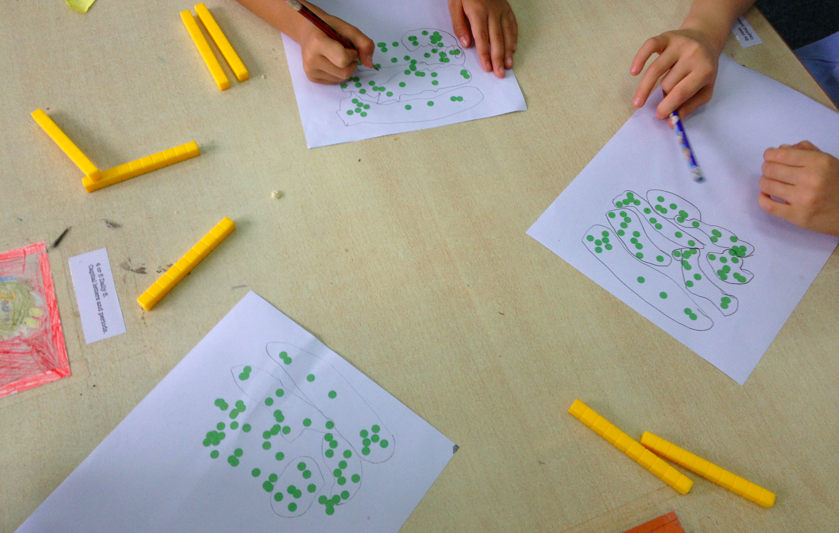
I had an amazing time this afternoon visiting my wife’s first grade class. I’ve been talking forever about how great it is to take a step out of the usual routines in class and look at a new problem, and my wife invited me in to try it with her students.

Here’s the run-down.

Act 1

[wpvideo 8kq5u3Cf]

Student questions (and the number of students that also found the questions interesting):

  • Why do the dots come together? (8)
  • Why are the dots making pictures and not telling us what they mean? (8)
  • Why are some dots going together into big dots, and others staying small? (13)
  • Why do some of the dots form blue lines before coming together?

My questions (and the number of students that humored me):

  • How many dots are there at the end? (8)
  • What is the final pattern of dots after the video ends? (11)

Guesses for the number of dots ranged from a low of 20 to a high of 90.

Act 2

What information did they want to know?

  • They wanted to see the video again.
  • Seven students asked about the numbers of tens or ones in each group. (I jumped on the use of that vocabulary right away – it seemed they are comfortable using this vocabulary based on my conversations with them.)
  • I showed them the video and gave them this handout since I didn’t have video players for all of the students:
    grouping dots

    What happened then was a series of amazing conversations with some really energetic and enthusiastic kids. They got right to work organizing and figuring out the patterns.
    Screen Shot 2013-06-11 at 3.29.15 PM

    Screen Shot 2013-06-11 at 3.31.36 PM

    Act 3

    We watched the video and discussed the results and how they got their answers. Lots of great examples of student-created systems for keeping track of their counting. We then watched the Act 3 video:
    [wpvideo N9OYqdqx]

    While nobody had the total number correct, I was quite impressed with their pride in being close. More interesting was how little they cared that they didn’t get the exact answer. I asked who was between 70 and 80, and a few kids raised their hands, and then the same with 50 – 70. One student was one off. Most were within ten or so of the correct answer. The relationship between the guesses and their answers after analysis was something we touched upon, but didn’t discuss outside of some one-on-one conversations.

    The absolute highlight of the lesson was when I asked why they thought nobody had the exact answer. One student walked up to the projector screen with out hesitation and pointed here:
    Screen Shot 2013-06-13 at 4.43.53 PM

    She said “this is what made it tough” and then sat back down.

    We had a little more time, so we watched a sequel video:
    [wpvideo xjc26Gjj]

    I asked what they saw that was different aside from the colors. One student said right away that he figured it out, the same student that first shouted out ‘tens!’ in Act 1. We lacked the time to go and figure it out, so we left it there as a challenge to figure out for the next class.

    Footnotes:

    • Any high school or middle school math teacher that wants to see how excited students can be when they are learning math needs to go take a group of elementary students through a three act. I wish I had done this during the dark February months when things drag for me. My wife asked me to do this to see how it works, but I think I got a lot more enjoyment out of the whole experience.
    • I made a conscious decision not to include any symbolic numbers in this exercise. It adds an extra layer of abstraction that takes away from the students figuring out what is going on. I almost put it back in when I wasn’t sure whether it was obvious enough. I am really glad I left it out so the students could prove that they didn’t need that crutch.
    • This is written in Javascript using Raphael. You can see a fully editable version of the code in this JSFiddle.
    • All files are posted at 101 Questions in case you want to get the whole package.
1 2 3 4 5 7