Rambling about Desmos, Meteor, and the Math-Twitter-Blogosphere

By my last week in the states this summer, I had made it to San Francisco. Before getting to the hard work of eating sourdough and tinkering my way through the Exploratorium, I made two stops that were really special.

The first was a chance to meet the Desmos team at their office, arranged by Dan Meyer, who was planning to be at the office. I walked into the office while the team, not two days from the successful release of their newest activity Central Park, was on a conference call discussing the next project. As my time with them went on, I periodically felt a wave of giddiness at the fact that I was sitting with some of the people responsible for making Desmos what it is.

The four people that I met there, two thirds of the entire team, had their hands in making a difference in hundreds (if not thousands) of classrooms around the world. Jason shared that his changes to some code had resulted in a substantial increase in the code speed. Jenny showed her prototypes for a beautiful new user interface. Eric repeatedly referred to the guiding principles of Desmos as they made decisions about moving forward. The careful, deliberate work done by this group of passionate people is the reason Desmos is able to create the collaborative learning experiences for which they are known.

At one point, David Reiman, one of the team members and a former teacher himself, asked me what they could do for me. Honestly, all I could muster was that it was an honor to learn from them and see their workflow. They put a lot of energy into making sure their tools are useful for reaching objectives in the classroom, not for the sake of merely being used in the general category of technology. I really appreciate Dan, Eric, Eli, and the rest of the team for arranging to spend time with me.

The next day involved a visit to Meteor headquarters for their monthly Devshop. This is a meeting that gets Meteor coders and entrepreneurs in one room with the goal of everyone helping each other. It was impressive to meet in person some people that I had really seen only as Twitter handles. They were all incredibly genuine, humble people that worked really hard on work that mattered to them. I gave a lightning talk on coding for the classroom (posted here on YouTube) and using code to make my life as a teacher easier. Mine was one of a series of such talks. They were streamed live on the internet, but it seemed much more intimate in the actual room. Each person had three minutes to talk about an idea that mattered to them. It was also a treat that people that came up to me to chat afterwards – some of them teachers themselves – to talk about teaching, coding, and the challenges of teaching effectively with technology.

The theme that struck me after both days, a theme that I think resonates strongly with the beauty of the existence of the Math-Twitter-Blog-o-sphere, is not just that individuals (and teams) are doing interesting, thought-provoking work. That has been true for a long time.

The people at Desmos and Meteor are designing tools that enable others to not just explore their ideas, but develop, build, and share them. Just as these tools are created iteratively (Meteor released version 0.9 today) they encourage others to make the most of what is out there to put ideas in front of an audience and make them better over time. That audience might be a classroom of students. It might be an audience craving a useful online tool that targets their unique niche. Everyone at these companies (and in classrooms) is hoping that the next idea they try is one that gets more people excited than the last. Teachers work in a similar vein hoping that their next idea for tweaking a lesson gets more students engaged and making connections than the last.

I’ve spent the past three academic years interacting with people through this blog, Twitter, and other online channels. I’ve shared ideas here and have gotten feedback on them from a number of different perspectives. All of us are working hard. We have ideas and share them because ideas sprout new ideas. This process is addictive. We all have our pet projects and obsessions, and need to be brought back to reality from time to time about what will really work most effectively. We listen to each other and value the conversations that happen.

As this year is getting underway, I’m going to work to keep something in mind this year. We all have governing principles that help us decide what work to tackle at a given point in time. We often wait to share ideas until they are fully formed, but that’s not really when we need the most feedback. I hope to share more ideas when they are raw and still forming. Bad days, especially when they are still smarting from an unsuccessful lesson, are revealing. It’s in these situations that we stand to grow the most. What makes innovative companies like Meteor and Desmos successful isn’t that they have the best ideas from the beginning. It’s that they know how to cultivate ideas from beginning to end, and aren’t afraid to make mistakes along the way. They acknowledge that there are lots of starts and stops and hiccups before ending up on the idea that will make a difference to people.

Have a great school year, everybody!

Picasso’s Bull – Not Just for Design Thinking

I came across the New York Times article on the Apple’s training program and its use in describing their design process. I hadn’t seen it before, but saw it also as a pretty good approximation for mathematical abstraction.

I used the lithographs 1 – 11 from http://artyfactory.com/art_appreciation/animals_in_art/pablo_picasso.htm and put them together like this:

Picasso - The Bull Lithographs 1 - 10
We have shortened classes tomorrow (20 minutes) and I think it might be good material for a way to introduce the philosophy of the IB Mathematics and Math 10 courses. Some potential questions floating in my head now:

  • How does this series of images relate to thinking mathematically?
  • What does the last representation have that the first representation does not? How is this similar to using math to model the world around us?
  • Can you do a similar series of drawings that show a similar progression of abstraction from your previous math classes?

This seems to be a really interesting line of thinking that connects well to the theory of knowledge component of the IB curriculum. I see this as a pretty compelling story line that relates to written representation of numbers, approximations, and the idea of creating mathematical models. Do you have other ideas for how this might be used with students?

Making Experts – A Project Proposal

tl;dr A Project Proposal:

I’d like to see expert ‘knowers’ in different fields each record a 2-4 minute video (uploaded to YouTube) in which they respond to one of the following prompts:

  • Describe a situation in which a simple change to what you knew made something that was previously impossible, possible.
  • Describe a moment when you had to unlearn what was known so that you could construct new ideas.
  • What misconception in your field did you need to overcome in yourself to become successful?

I think that teachers model knowledge creation by devoting time to exploring it in their classes. I think we can show them that this process isn’t just something you do until you’ve made it – it is a way of life, especially for the most successful people in the world. I think a peek behind the curtain would be an exciting and meaningful way for students to see how the most knowledgeable in our society got that way.

Long form:

One thing we do as teachers that makes students roll their eyes in response is this frequent follow up to a final answer: How do you know?

This is a testament to our commitment to being unsatisfied with an answer being merely right or wrong. We are intensely committed to understanding and emphasizing process as teachers because that’s where we add the most value. Process knowledge is valuable. An engineering company can release detailed manufacturing plans of a product design and know they will remain profitable because their value is often stored within the process of building the product, not the design itself. This is, as I understand it, much if the power of companies dealing in open source technologies.

In a field like ours, however, students often get a warped sense of the value of process. They don’t hear experts talking about their process of learning to be experts, which inevitably involves a lot of failure, learning, unlearning, and re-learning. In some of the most rapidly changing fields – medicine, technology, science for example – it is knowledge itself that is changing.

An important element of the IB program is the course in Theory of Knowledge (abbreviated TOK). In this course, students explore the nature of knowledge, how it represents truth, how truth may be relative, and other concepts crucial to understanding what it means to ‘know’ something to be true. From what I have heard from experienced IB educators, it can be a really satisfying course for both teachers and students. Elements of TOK are included as essential parts of all of the core courses that students take.

I can certainly find lots of specific ways to bring these concepts up in mathematics and science. Creating definitions and exploring the consequences of those definitions is fundamental to mathematics. Newton ‘knew’ that space was relative, but time was absolute. Einstein reasoned through a different set of rules that neither was absolute. These people, however, are characters in the world of science. Their processes of arriving at what they knew to be true don’t get much airtime.

What if we could get experts in fields talking about their process of knowing what they know? What if students could see these practitioners themselves describing how they struggled with unlearning what they previously believed to be absolutely true? I see only good things coming of this.

What do you think? Any takers?

Summer Updates

One of my favorite parts of summer is reflecting on the past year and brainstorming new ideas for the next. On my mind these days:

  • Refining my standards based grading system after this past semester and year’s implementation
  • Building my IB courses for math(s) and physics, which will have both HL and SL in the same class period
  • Sharing ways that programming has made my teaching life easier and richer
  • Better making the most of in-class time, as well as maximizing the benefit of time students spend on their own

There are posts brewing in my head on each of these. At the moment, I’m on a road trip headed west and plan to enjoy my time enjoying the views and life, so these will likely live only in my head for now.

Stay tuned for the roll out.20140716-220459-79499383.jpg

Testing probability theories with students

One of the things that has excited me after building computational tools for my students is using those tools to facilitate play. I really enjoyed, for example, doing Dan Meyer’s money duck lesson with my 10th grade students as the opener for the probability unit. My experiences doing it weren’t substantially different that what others have written about it, so I won’t comment too much on that here.

The big thing that hampered the hook of the lesson (which motivated the need for knowing how to calculate expected value) was that about a third of the class took AP statistics this year, so they already knew how to do this. This knowledge spread quickly as the students taught the rest how to do it. It was a beautiful thing to watch.

I modified the sequel. I’ll explain, but first some back story.

My students have been using a tool I created for them to sign up for reassessments. Since they are all logged in there, I can also use those unique logins to track pretty much anything else I am interested in doing with them.

After learning a bit about crypto currency a couple of months ago, I found myself on this site related to gambling Doge coins. Doge coins is a virtual currency that isn’t in the news as much as Bitcoin and seems to have a more wholesome usage pattern since inception. What is interesting to me is not making money this way through speculation – that’s the unfortunate downside of any attempt to develop virtual currency. What I’ve been amazed by is the multitude of sites dedicated to gambling this virtual currency away. People have fun getting this currency and playing with it. You can get Dogecoins for free from different online faucets that will just give them away, and then gamble them to try to get more.

Long story short, I created my own currency called WeinbergCash. I gave all of my students $100 of WeinbergCash (after making clear written and verbal disclaimers that there is no real world value to this currency). More on this later.

After the Money Duck lesson, I gave my students the following options with which to manage their new fortune in WeinbergCash:

Screen Shot 2014-05-21 at 5.17.26 PM

Then I waited.

After more than 3,000 clicks later, I had quite a bit of data to play with. I can see which wagers individual students are making. I can track the rise and fall of a user’s balance over time. More importantly, I can notice the fact that just over 50% of the students are choosing the 4x option, 30% chose 2x, and the remaining 20% chose 3x. Is this related to knowledge about expected value? I haven’t looked into it yet, but it’s there. To foster discussion today, I threw up a sample of WeinbergCash balance graphs like this:

Screen Shot 2014-05-21 at 5.24.49 PM

Clearly most people are converging to the same result over time.

My interests in continuing this experiment are buzzing with two separate questions:

  • To what extent are students actually using expected value to play this game intelligently? If you make the calculations yourself, you might have an answer to this question. I haven’t parsed the data yet to see the relationship between balances and grade level, but I will say that most students are closer to zero than they are their starting balance. How do I best use this to discuss probability, uncertainty, predictions, volatility?
  • To what extent do students assign value to this currency? I briefly posted a realtime list of WeinbergCash totals in the classroom when I first showed them this activity. Students saw this and scrambled to click their little hearts away hoping to see their ranking rise (though it usually did the opposite). Does one student see value in this number merely because it reflects their performance relative to others? Is it merely having something (even though it is value-less by definition) and wanting more of it, knowing that such a possibility is potentially a click away?

I had a few students ask this afternoon if I could give them more so they could continue to play. One proposed that I give them an allowance every week or every day. Another said there should be a way to trade reassessment credits for WeinbergCash (which I will never do, by the way). Clearly they have fun doing this. The perplexing parts of this for me is first, why, and second, how do I use this to push students toward mastery of learning objectives?

I keep the real-time list open during the day, so if students are doing it during any of their academic classes, I just deactivate them from the gambling system. For me, it was more of an experiment and a way to gather data. I’d like to use this data as a way to teach students some basic database queries for the purposes of calculating experimental probability and statistics about people’s tendencies here. I think the potential for using this to generate conversation starters is pretty high, and definitely underutilized at this point. It might require a summer away from teaching duties to think about using this potential for good.

A new year in the cold: how can we play with this?

My wife and I spent our winter break exploring two places: Tibet and Harbin, China. Harbin is the location of the Harbin Ice and Snow Festival, where they do some impressive work building with ice and snow to show off for the rest of the world.

Screen Shot 2014-01-11 at 10.49.01 PM

We spent our first day in Harbin’s sub zero temperatures wandering around on the frozen river. The locals have confronted the fact that their local river freezes over with a simple question: How do we play with this?
Screen Shot 2014-01-11 at 10.50.48 PM

They have a number of simple answers.

From bumper cars, to ice slides, to team-driven ice sleighs…
Screen Shot 2014-01-11 at 10.52.47 PM

…to ice bicycles, complete with a hilariously ineffective brake pedal:
Screen Shot 2014-01-11 at 10.54.10 PM

The locals in Harbin have taken the brutal reality of their sub-zero temperatures (in both Fahrenheit and Celsius) and created some creative channels through which to enjoy that cold environment in ways that are enjoyable, cooperative, and unique.

The question “how do we play with this?” has become the organizing question for lessons in my classroom. I want to give students chances to explore, have fun, and work together in the process. Though I don’t always do so, I think the pursuit is a worthy one.

This blog has been silent for a while, not for any negative reasons, but because the realities of organizing for my classroom and school have compelled me to put my energy in places other than structured reflection. I hope to do more sharing, more reflection, and give more appreciation toward the members of my personal learning network in the latter half of this year. I wish everyone a productive, enjoyable, and satisfying 2014.

Computational Thinking and Algebraic Expressions

I am still reviewing algebra concepts in my Math 9 course with students. The whole unit is all about algebraic operations, but my students have seen this material at least once, in some cases two years running.

Not long ago, I made the assertion that the most harmful part of introducing students to the world of real-world algebra looks like this:

Let x = the number of ________

Why is this so harmful?

For practiced mathematicians, math teachers, and students that have endured school math for long enough, there are a couple steps that actually happen internally before this step of defining variables. Establishing a context for the numbers and the operations that link them together are the most important part of producing a correct mathematical model for a given situation. A level of intuition and experience is necessary if one is going to successfully skip straight to this step, and most students don’t have this intuition or experience.

We have to start with the concrete because most people (including our students) start their thinking in concrete terms. This is the reason I have raved previously about the CME Project and the effectiveness of using their guess-check-generalize concept in introducing word problems to students. It forms an effective bridge between the numbers that students understand and the abstract concept of a variable. It encourages experimentation and analysis of whether a given answer matches the constraints of a problem.

This method, however, screams for computers to take care of the arithmetic so that students can focus on manipulating the variables involved. Almost all of the Common Core Standards for Mathematical Practice point toward this being an important focus for our work with students. I haven’t had a great point in my curriculum since I really started getting into computational thinking to try out my ideas from the beginning, but today gave me a chance to do just that.

Here’s how I introduced students to what I wanted them to do:

I then had them open up this spreadsheet and actually complete the missing elements of the spreadsheet on their own. Some students had learned to do similar tasks in a technology class, but some had not.
02 – SPR – Translating Algebraic Expressions

Screen Shot 2013-09-06 at 3.59.38 PM

The students that needed to have conversations about tricky concepts like three less than a number had them with me and with other students when they came up. Students that didn’t quickly moved through the first set. I’d go and throw some different numbers for ‘a number’ and see that they were all changing as expected. Then we moved to a more abstract task:

It’s great to see that you know how to use different operations on the number in that cell. Now let’s generalize. Pick a variable you like – x, or N, or W – it doesn’t matter. What would each of these cells become then? Write those results together with the words in your notebook and show me when you’re done.

The ease with which students moved to this next task was much greater than it has ever been for me in past lessons. We also had some really great conversations about x*2 compared with 2x, and the fact that both are correct from an arithmetic standpoint, but one is more ‘traditional’ than the other.

Once students got to this point, I pushed them toward a slightly higher level task that still began concrete. This is the second sheet from the spreadsheet above:
Screen Shot 2013-09-06 at 4.06.07 PM

Here we had multiple variables going at once, but this was not a stretch for most students. The key that I needed to emphasize here for some students was that the red text was all calculated. I wanted to put information in the black boxes with black text only, and have the spreadsheet calculate the red values. This required students to identify what the relationship between the variables needed to be to obtain the answer they knew in their head had to be true. This is CCSS MP2, almost verbatim.

This is all solidifying into a coherent framework of using spreadsheet and programming tools to reinforce algebra instruction from the start. There’s still plenty to figure out, but this is a start. I’ll share what I come up with along the way.

Class-sourcing data generation through games

In my newly restructured first units for ninth and tenth grade math, we tackle sets, functions, and statistics. In the past, teaching these topics have always involved collecting some sort of data relevant to the class – shoe size, birthday, etc. Even though making students part of the data collection has always been part of my plan, it always seems slower and more forced than I want it to be. I think the big (and often incorrect) assumption is that because the data is coming from students, they will find it relevant and enjoyable to collect and analyze.

This summer, I remembered a blog post from Dan Meyer not too long ago describing a brilliantly simple game shared by Nico Rowinsky on Twitter. I had tried this manually with pencil and paper and students since hearing about it. It always required a lot of effort collecting and ordering papers with student guesses, but student enthusiasm for the game usually compelled me to run a couple of rounds before getting tired of it. It screamed for a technology solution.

I spent some time this summer learning some of the features of the Meteor Javascript web framework after a recommendation from Dave Major. It has the real-time update capabilities that make it possible to collect numbers from students and reveal a scoreboard to all users simultaneously. You can see my (imperfect) implementation hosted at http://lownumber.meteor.com, and the code at Github here. Dave was, as always, a patient mentor during the coding process, eagerly sharing his knowledge and code prototypes to help me along.

If you want to start your own game with friends, go to lownumber.meteor.com/config/ and select ‘Start a new game’, then ask people to play. Wherever they are in the world, they will all see the results show up almost instantly when you hit the ‘Show Results’ button on that page. I hosted this locally on my laptop during class so that I could build a database of responses for analysis later by students.

The game was, as expected, a huge hit. The big payoff was the fact that we could quickly play five or six games in my class of twenty-two grade nine students in a matter of minutes and built some perplexity through the question of how one can increase his or her chances of winning. What information would you need to know about the people playing? What tools do we have to look at this data? Here comes statistics, kids.

It also quickly led to a discussion with the class about the use of computers to manage larger sets of data. Only in a school classroom would one calculate measures of central tendency by hand for a set of data that looks like this:
Screen Shot 2013-08-22 at 7.41.14 PM

This set also had students immediately recognizing that 5000 was an outlier. We had a fascinating discussion when some students said that out of the set {2,2,3,4,8}, 8 should be considered an outlier. It led us to demand a better definition for outlier than ‘I know it when I see it’. This will come soon enough.

The game was also a fun way to introduce sets with the tenth graders by looking at the characteristics of a single set of responses. Less directly related to the goal of the unit, but a compelling way to get students interacting with each other through numbers. Students that haven’t tended to speak out in the first days of class were on the receiving end of class-wide cheers when they won – an easy channel for low pressure positive attention.

As you might also expect, students quickly figured out how to game the game. Some gave themselves entertaining names. Others figured out that they could enter multiple times, so they did, though still putting in their name each time. Some entered decimals which the program rounded to integers. All of these can be handled by code, but I’m happy with how things worked out as is.

If you want instructions on running this locally for your classroom, let me know. It won’t be too hard to set up.

Standards Based Grading & Unit Tests

I am gearing up for another year, and am sitting in my new classroom deciding the little details that need to be figured out now that it is the “later” that I knew would come eventually. Last year was the first time I used SBG to assess my students. One year in, I understand things much better than when I first introduced the concept to my students. By the end of the year, they were pretty enthusiastic about the system and appreciated that I had made the change.

I wonder now about the role of unit tests. Students did not get an individual grade for a test at the end of a unit – instead just a series of adjustments to their proficiency levels for the different standards of the related unit, and other units if there were questions that assessed them. While there were times for students to reassess during class and before and after school, a full period devoted to this purpose helped in a few unique ways that I really appreciate:

  • All students reassessing at the same time means no issues with scheduling time for retakes.
  • Students that have already demonstrated their ability to work independently to apply content standards are given an opportunity to do so in the context of all of the standards of the unit. They need to decide which standards apply in a given situation, which is a higher level rung of cognitive demand. This is why students that perform well on a unit exam usually move up to a 4 or 5 for the related standards.
  • Students that miss a full period assessment due to illness, school trips, etc. know that they must find another time to assess on the standards in order to raise their mastery level. It changes the conversation from ‘you missed the test, so here’s a zero’ to ‘you missed an opportunity to raise your mastery level, so your mastery levels are staying right where they are while we move on to new topics.’

I also like the unintended connection to the software term unit testing in which the different components of a piece of software are checked to see that they function independently and in concert with each other. This is what we are interested in seeing through reassessment, no?

My question to the blogosphere is to fill in the holes of my understanding here. What are the other reasons to have unit exams? Or should I get rid of them altogether and just have more scheduled extended times to reassess consistently, regardless of progress throughout the content of the semester?

Half Full Activity – Results and Debrief

Screen Shot 2013-07-10 at 7.07.48 AM

If you haven’t yet participated, visit http://apps.evanweinberg.org/halffull/ and see what it’s all about. If I’ve ever written a post that has a spoiler, it’s this one.

First, the background.

“A great application of fractions is in cooking.”

At a presentation I gave a few months ago, I polled the group for applications of fractions. As I expected, cooking came up. I had coyly included this on the next slide because I knew it would be mentioned, and because I wanted the opportunity to call BS.

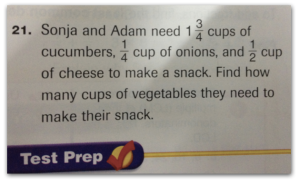
While it is true that cooking is probably the most common activity where people see fractions, the operations people learn in school are never really used in that context. In a math textbook, using fractions looks like this:

Screen Shot 2013-07-10 at 7.15.13 AM

In the kitchen, it looks more like this:
IMG_0571

A recipe calls for half of a cup of flour, but you only have a 1 cup measure, and to be annoying, let’s say a 1/4 cup as well. Is it likely that a person will actually fill up two 1/4 cups with flour to measure it out exactly? It’s certainly possible. I would bet that in an effort to save time (and avoid the stress that is common to having to recall math from grade school) most people would just fill up the measuring cup halfway. This is a triumph of one’s intuition to the benefits associated with using a more mathematical methods. In all likelihood, the recipe will turn out just fine.

As I argued in a previous post, this is why most people say they haven’t needed the math they learned in school in the real world. Intuition and experience serve much better (in their eyes) than the tools they learned to use.

My counterargument is that while relying on human intuition might be easy, intuition can also be wrong. The mathematical tools help provide answers in situations where that intuition might be off and allows the error of intuition to be quantified. The first step is showing how close one’s intuition is to the correct answer, and how a large group of people might share that incorrect intuition.

Thus, the idea for half full was born.

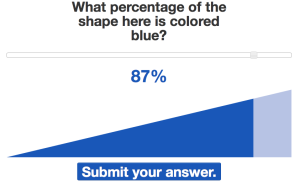
The results after 791 submissions: (Links to the graphs on my new fave plot.ly are at the bottom of the post.)

Rectangle

Screen Shot 2013-07-10 at 7.42.14 AM
Mean = 50.07, Standard Deviation = 8.049

Trapezoid

Screen Shot 2013-07-10 at 7.47.10 AM
Mean = 42.30, Standard Deviation = 9.967

Triangle

Screen Shot 2013-07-10 at 7.50.55 AM
Mean = 48.48, Standard Deviation = 14.90

Parabola

Screen Shot 2013-07-10 at 7.55.34 AM
Mean = 51.16, Standard Deviation = 16.93

First impressions:

  • With the exception of the trapezoid, the mean is right on the money. Seems to be a good example of wisdom of the crowd in action.
  • As expected, people were pretty good at estimating the middle of a rectangle. The consistency (standard deviation) was about the same between the rectangle and the trapezoid, though most people pegged the half-way mark lower than it actually was on the trapezoid. This variation increased with the parabola.
  • Some people clicked through all four without changing anything, thus the group of white lines close to the left end in each set of results. Slackers.
  • Some people clearly went to the pages with the percentage shown, found the correct location, and then resubmitted their answers. I know this both because I have seen the raw data and know the answers, and because there is a peak in the trapezoid results where a calculation error incorrectly read ‘50%’.

    I find this simultaneously hilarious, adorable, and enlightening as to the engagement level of the activity.

Second Impressions

  • As expected, people are pretty good at estimating percentage when the cross section is uniform. This changes quickly when the cross section is not uniform, and even more quickly when a curve is involved. Let’s look at that measuring cup again:
    IMG_0571

    In a cooking context, being off doesn’t matter that much with an experienced cook, who is able to get everything to balance out in the end. My grandmother rarely used any measuring tools, much to the dismay of anyone trying to learn a recipe from her purely from observing her in the kitchen. The variation inherent in doing this might be what it means to cook with love.

  • My dad mentioned the idea of providing a score and a scoreboard for each person participating. I like the idea, and thought about it before making this public, but decided not to do so for two reasons. One, I was excited about this and wanted to get it out. Two, I knew there would probably be some gaming the system based on resubmitting answers. This could have been prevented through programming, but again, it wasn’t my priority.
  • Jared (@jaredcosulich) suggested showing the percentage before submitting and moving on to the next shape. This would be cool, and might be something I can change in a later revision. I wanted to get all four numbers submitted for each user before showing how close that user was in each case.
  • Anyone who wants to do further analysis can check out the raw data in the link below. Something to think about : The first 550 entries or so were from my announcement on Twitter. At that point, I also let the cat out of the bag on Facebook. It would be interesting to see if there are any data differences between what is likely a math teacher community (Twitter) and a more general population.

This activity (along with the Do You Know Blue) along with the amazing work that Dave Major has done, suggests a three act structure that builds on Dan Meyer’s original three act sequence. It starts with the same basic premise of Act 1 – a simple, engaging, and non-threatening activity that gets students to make a guess. The new part (1B?) is a phase that allows the student to play with that guess and get feedback on how it relates to the system/situation/problem. The student can get some intuition on the problem or situation by playing with it (a la color swatches in Do You Know Blue or the second part of Half Full). This act is also inherently social in that students easily share and see the work of other students real time.

The final part of this Act 1 is the posing of a problem that now twists things around. For Half Full, it was this:

Screen Shot 2013-07-10 at 8.37.30 AM

Now that the students are invested (if the task is sufficiently engaging) and have some intuition (without the formalism and abstraction baggage that comes with mathematical tools in school), this problem has a bit more meaning. It’s like a second Act 1 but contained within the original problem. It allows for a drier or more abstract original problem with the intuition and experience acting as a scaffold to help the student along.

This deserves a separate post to really figure out how this might work. It’s clear that this is a strength of the digital medium that cannot be efficiently done without technology.

I also realize that I haven’t talked at all about that final page in my activity and the data – that will come later.

A big thank you to Dan Meyer for his notes in helping improve the UI and UX for the whole activity, and to Dave Major for his experience and advice in translating Dan’s suggestions into code.


Handouts:

Graphs

The histograms were all made using plot.ly. If you haven’t played around with this yet, you need to do so right away.

Rectangle: https://plot.ly/~emwdx/10

Trapezoid: https://plot.ly/~emwdx/11

Triangle: https://plot.ly/~emwdx/13

Parabola: https://plot.ly/~emwdx/8

Raw Data for the results presented can be found at this Google Spreadsheet.

Technical Details

  • Server side stuff done using the Bottle Framework.
  • Client side done using Javascript, jQuery, jQueryUI, Raphael for graphics, and JSONP.
  • I learned a lot of the mechanics of getting data through JSONP from Chapter 6 of Head First HTML5 Programming. If you want to learn how to make this type of tool for yourself, I really like the style of the Head First series.
  • Hosting for the app is through WebFaction.
  • Code for the activity can be found here at Github.
1 4 5 6 7 8 11