Magnetic Fields, Data Collection, and You(r dog)

Assignment 1: Read the following abstract for a scientific paper.

Dogs are sensitive to small variations of the Earth’s magnetic field

Not too bad, right? Now read this more palatable explanation of what this really means:
Dogs align their bodies along a North-South axis….

Finally, here’s a composite image I’ve put together:
Screen Shot 2014-02-16 at 8.09.41 AM

For all of these, the top of the phone was facing the same direction as my dog’s nose during the act. These were all in different locations in the same yard, so it was clear to me that he wasn’t just finding the same spot every time. It took copious treats and showing my dog the photos to convince him that I was not taking a picture of him while he did his business.

It’s possible to get over the social peculiarity of remembering to pull out your phone, start the compass application, and take a screenshot whenever your dog pops a squat. To me, this seems like a ripe opportunity for a student project in statistics and data analysis. Furthermore, the potential for doing this now (compared to just a few years ago) is better than ever. Why?

  1. There are lots of dogs around, because dogs are awesome. They all have to unload at some point in the day. That makes for a large potential sample set of data to work with.
  2. It’s all about number two, which is (of course) hilarious and engaging to all of us. I chuckled first when I read the headline of this story, and then a second time when I realized that scientists observed 1,893 defecation events and then sorted them according to magnetic field activity. I propose that this paper might include the term ‘defecation events’ more frequently than any other academic paper, and for that reason alone, it is special.
  3. Now more than ever, we have these great devices in our pockets that are not just capable of capturing such screenshots easily, but combine other useful information that might be important factors for students to consider. Time, date, geotagging information for location – all useful things students might choose to analyze in seeing if the results of this study are repeatable.
  4. Crowdsourcing. I took eight of these pictures, my wife took a few more. Imagine the potential of getting a photo stream of defecation event data for students to analyze from dogs around the world. Wolfram Alpha pegs the number of dogs in the US at 78.2 million.

Here’s what I propose. If you’re into this, take some data on the next outing with your dog. Some suggestions to maintain data integrity:

  • Stand behind the test subject and align the phone so that the top of your phone points in the direction your dog is looking while he/she concentrates on the task at hand.
  • Make sure your compass is calibrated when you take data.
  • Snap a screenshot of the compass screen. On iOS, hold the Home and Power buttons simultaneously, then release the power button. I found out from Lifehacker that in Android 4, you just hold down the power and volume-down buttons.
  • Now’s the time to take a big (data) dump – upload those screenshots to Flickr, Instagram, etc. with the hashtag #DogsPoopNorth .

I don’t teach statistics, but I’d love to see a class take a chunk of data and show that there is signal in the noise. The original researchers clearly showed this, but it’s a great experience to have students do their own analysis work and come to their own conclusion about whether dogs have this unique ability or not.

Get to work, interwebs. I’m really interested to see what comes out.

What do you mean by ‘play with the equation’?

My professional obsessions lately have focused on using technology to turn traditional processes of learning into more inquiry based ones. A really big part of this is purely in the presentation.

Here’s the traditional sequence:

Screen Shot 2014-01-23 at 5.08.01 PM

  • Calculate the force between the Earth (mass 5.97 x 10^24 kg) and an apple (100 g) at the surface of the Earth (which has a radius of 6.37 x 10^6meters.
  • If the Earth somehow doubles in mass, but keeps the same size, what would happen to the force of gravity?
  • Find at what distance from Earth’s center the gravity force would be equal to 0.5 Newtons.

My observation in this type of sequence is that the weaker algebra students (or students that use the presence of mathematics as a way out of things) will turn off the moment you say calculate. The strong students will say ‘this is easy’, throw these in a calculator, and write down answers without units.

A modified presentation would involve showing students a spreadsheet that looks like this:
Screen Shot 2014-01-23 at 5.21.20 PM

  • Calculate the force between the Earth (mass 5.97 x 10^24 kg) and an apple (100 g) at the surface of the Earth (which has a radius of 6.37 x 10^6meters.
  • If the Earth somehow doubles in mass, but keeps the same size, what would happen to the force of gravity?
  • Find at what distance from Earth’s center the gravity force would be equal to 0.5 Newtons.

I would argue that this is, for many students, just as much of a black box as the first. In this form, however, students are compelled to tinker and experiment. Look for patterns. Figure out what to change and what to keep the same. In the last question, students will likely guess and check, which may get tedious if the question changes. This tedium might motivate another approach. A mathematically strong student might double click on the force cell and look up the function, or look up Newton’s Law of Gravitation on Wikipedia and try to recreate the spreadsheet on his or her own. A weaker student might be able to play with the numbers and observe how doubling the mass doubles the force, and feel like he or she has a way to answer these questions, albeit inefficiently. Both students have a path to wrestle with the question that forms the basis of physics: how do we model what we observe in our universe?

This approach makes obvious what it means to play with a mathematical object such as an equation. Playing with an equation is something that I’ve admittedly said to students before in a purely algebraic context. I know that I mean to rearrange the equation and solve for the variable that a given question is asking for. Students don’t typically think this way in math or science, or any equation that we give them. If they do, it’s because we’ve artificially trained them to think that this is what experimentation in math looks like. I think that this is primarily because the user interface of math, which has been paper and pencil for thousands of years, doesn’t lend itself to this sort of experimentation easily. Sure, the computer is a different interface, and has its own input language that is sometimes quite different from mathematical language itself, but I think students are better at managing this gap than we might give them credit for.

Proofs in Geometry – The Modification Continues…

Two statements of interest to me:

  • I get more consistent daily hits on my blog for teaching geometry proofs than anything else. Shiver.
  • Dan Meyer’s recent post on proofs in Geometry gets to the heart of what bothers me about teaching proofs at all. Double shiver.

These statements have made me think about my approach in doing proofs with students in my 9th grade course, which has previously been a geometry course, but is morphing into something slightly different in anticipation of our move to the IB program. I like the concept of teaching proofs because I force students to confront the idea that there’s a difference between things they know must be true, might be true, and will never be true. I started the unit asking the class the following questions:

  • Will the sun rise tomorrow?
  • Will student A always be older than her younger sister?
  • Will the boys volleyball team win the tournament this weekend>

The clear difference between these questions was also clear to my students. The word ‘obviously’ came up at least once, as expected.

The idea of proving something that is obvious is certainly an exercise of questionable purpose, mostly because it confines student thinking in the mould of classroom mathematics. As geometry teachers, we do this as a scaffold to help students learn to write proofs of concepts that are not so obvious. The downside is the inherent lack of perplexity in this process, as Dan points out in his post. The rules of math that students routinely apply to solve textbook or routine problems already fit in this ‘obvious’ category either from tradition (‘I’ve done this since, like, forever’) or from obedience (‘My teacher/textbook says this is true, and that’s good enough for me.’)

I usually go to Geogebra to have students discover certain properties to be true, or give a quick numerical example showing why two angles supplementary to the same angle are congruent. They get this, but have a sense of detachment when I then ask them to prove it using the properties we reviewed in previous lessons. It seems to be very much related to what Kate Nowak pointed out in her comment to Dan’s post. Geometry software or numerical examples show something to be so obvious that proof isn’t necessary, so why circle back to then use the rules of mathematics to prove it to be true?

I had an idea this afternoon that I plan to try tomorrow to close this gap.
I wrote earlier about using spreadsheets with students to take some of the abstraction out of translating algebraic expressions. Making calculations with variables in the way a spreadsheet does shows very clearly the concept of variables, and also doing arithmetic with them. My idea here is to use a spreadsheet this way:

Screen Shot 2013-11-10 at 5.35.43 PM

Screen Shot 2013-11-10 at 5.37.39 PM

My students know that they should be able to change what is in the black cells, and enter formulas in the red cells so that they change based on what is in the black cells only. In doing this, they will be using their algebraic rules and geometric definitions to complete a formula. This hits the concrete examples I mentioned above – a 25 degree angle complementary to an angle will always be congruent to a 25 degree angle complementary to that same angle. It also uses the properties (definition of a complementary angle, subtraction property of equality, definition of congruence) to suggest the relationship between those angles using the language and structure of proof, which comes next in class.

Here is the spreadsheet file I’ve put together:
02 – SPR – Congruent Angles

I plan to have them complete the empty cells in this spreadsheet and then move on to filling in some reasons for steps of more formal proofs of these theorems afterwards, as I have done previously. I’d like to think that doing this will make it a little more clear how the observations students have relate to the properties they then use to prove the theorems.

I’d love you to hack away at my idea with feedback in the comments.

Reassessment Web-App Update

I wrote last May about the difficulties I was having with doing reassessments efficiently. The short story – collecting reassessment requests, printing them, and distributing them to students was not scaling well. I had shared my progress on making a web application using Python to do this and was really excited to continue working on it.

After a summer of work and putting it into action this fall, Phases 1 and 2 are pretty much complete. I’m really happy with how it has been working for me. I host it on my personal laptop in the classroom and share its IP address with students so they can access their quizzes.


You can check out a mildly sandboxed version here:
http://quiz.evanweinberg.org/main/

UPDATE Mar. 2016: I’ve taken down the application to save memory on my hosting server. Write me if you are interested in learning more.

and the code is posted at Github:
https://github.com/emwdx/reassess

I took out a number of my questions (since students do occasionally read my blog) and made it so images can’t be uploaded. I hear that might be a security risk.

Some highlights:

  • Questions (with or without images) can be added, edited, and browsed all through a web interface.
  • Students can be assigned quizzes individually or through a page for the class they are in. They can also all be given different questions, which helps in my class that has students fairly close together.
  • Students each have their own url that can be bookmarked for easy access later.
  • The teacher view of the entire class has a link for each student that shows the quiz questions (and answers, if they are in the database) for easy grading.

What hasn’t been done:

  • Authentication for students and the admin side. Right now it’s all open, which bothers me a little, but my access log doesn’t show that this is being abused.
  • A way to capture their work digitally for each retake. I still have a pile of half-size A4 papers on my desk, and have to grade them while also having the answer page open. That isn’t the end of the world, but after my recent obsession with collecting as much student work as I can through a web interface, it’s something I’d like to have as an option. Students tend to lose these papers, and these are the formative assessment moments I’d love for them to include in their portfolios. Digital is clearly the way to go.
  • Randomization (phase 3 of my master plan), but in two different ways. I’m still manually choosing questions for students. I kind of want to keep it that way, since some students I do want to give different questions. But then I sometimes don’t – I’d rather it just choose questions from specific standards and students get the luck of the draw. I need an option that lets me waffle on this.
  • Question history – i.e. knowing which questions a student has been assigned, and integrating this into the program smoothly. This function is built into the database already, and won’t require a lot of work to make it happen, but I haven’t done it. Sorry.

There are a number of bugs features that still need to be worked out, but I’m aware of them all and know how to work through them when I have a bunch of students taking quizzes.

The most powerful aspect of having this working is that I can easily assess the whole class at the whole time on different questions if I want them to be different. I’ve been doing this at the beginning of the class this semester, and it increases the amount of time I spend talking to each student about their work regularly. Since student initiated reassessment still isn’t as widespread as I want it to be, I’ve started having students request which quiz they want to have in class the night before. They know it’s coming, and can get help or prepare in advance, rather than using their valuable lunch or after school time. More on that later.

Let me know if you’re interested in using this with your own class – it’s pretty portable and can be adapted without too much of a headache to different situations.

Computation & CAPM – From Models to Understanding

I wrote last spring about beginning my projectile motion unit with computational models for projectiles. Students focused on using the computer model alone to solve problems, which led into a discussion of a more efficient approach with less trial and error. The success of this approach made me wonder about introducing the much more simpler particle model for constant acceleration (abbreviated CAPM) using a computational model first, and then extending the patterns we observed to more general situations

We started the unit playing around with the Javascript model located here and the Geogebra data visualizer here.

The first activity was to take some position data for an object and model it using the CAPM model. I explained that the computational model was a mathematical tool that generated position and velocity data for a particle that traveled with constant acceleration. This was a tedious process of trial and error by design.

The purpose here was to show that if position data for a moving object could be described using a CAPM model, then the object was moving with constant acceleration. The tedium drove home the fact that we needed a better way. We explored some different data sets for moving objects given as tables and graphs and discussed the concepts of acceleration and using a linear model for velocity. We recalled how we can use a velocity vs. time graph to find displacement. That linear model for velocity, at this point, was the only algebraic concept in the unit.

In previous versions of my physics course, this was where I would nudge students through a derivation of the constant acceleration equations using what we already understood. Algebra heavy, with some reinforcement from the graphs.

This time around, my last few lessons have all started using the same basic structure:

  1. Here’s some graphical or numerical data for position versus time or a description of a moving object. Model it using the CAPM data generator.
  2. Does the CAPM model apply? Have a reason for your answer.
  3. If it does, tell me what you know about its movement. How far does it go? What is its acceleration? Initial velocity? Tell me everything that the data tells you.

For our lesson discussing free fall, we started using the modeling question of asking what we would measure to see if CAPM applies to a falling object. We then used a spark timer (which I had never used before, but found hidden in a cabinet in the lab) to measure the position of a falling object.Screen Shot 2013-11-01 at 5.03.23 PM

They took the position data, modeled it, and got something similar to 9.8 m/s2 downward. They were then prepared to say that the acceleration was constant and downwards while it was moving down, but different when it was moving up. They quickly figured out that they should verify this, so they made a video and used Logger Pro to analyze it and see that indeed the acceleration was constant.

The part that ended up being different was the way we looked at 1-D kinematics problems. I still insisted that students use the computer program to model the problem and use the results to answer the questions. After some coaching, the students were able to do this, but found it unsatisfying. When I assigned a few of these for students to do on their own, they came back really grumpy. It took a long time to get everything in the model to work just right – never on the first try did they come up with an answer. Some figured out that they could directly calculate some quantities like acceleration, which reduced the iteration a bit, but it didn’t feel right to them. There had to be a better way.

This was one of the problems I gave them. It took a lot of adjustment to get the model to match what the problem described, but eventually they got it:
Screen Shot 2013-11-01 at 5.11.47 PM

Once the values into the CAPM program and it gave us this data, we looked at it together to answer the question. Students started noticing things:

  • The maximum height is half of the acceleration.
  • The maximum height happens halfway through the flight.
  • The velocity goes to zero halfway through the flight.

Without any prompting, students saw from the data and the graph that we could model the ball’s velocity algebraically and find a precise time when the ball was at maximum height. This then led to students realizing that the area of the triangle gave the displacement of the ball between being thrown and reaching maximum height.

This is exactly the sort of reasoning that students struggle to do when the entire treatment is algebraic. It’s exactly the sort of reasoning we want students to be doing to solve these problems. The computer model doesn’t do the work for students – it shows them what the model predicts, and leaves the analysis to them.

The need for more accuracy (which comes only from an algebraic treatment) then comes from students being uncomfortable with an answer that is between two values. The computation builds a need for the algebraic treatment and then provides some of the insight for a more generalized approach.

Let me also be clear about something – the students are not thrilled about this. I had a near mutiny during yesterday’s class when I gave them a standards quiz on the constant acceleration model. They weren’t confident during the quiz, most of them wearing gigantic frowns. They don’t like the uncertainty in their answers, they don’t like lacking a clear roadmap to a solution, they don’t like being without a single formula they can plug into to find an answer. They said these things even after I graded the quizzes and they learned that the results weren’t bad.

I’m fine with that. I’d rather that students are figuring out pathways to solutions through good reasoning than blindly plugging into a formula. I’d rather that all of the students have a way in to solving a problem, including those that lack strong algebraic skills. Matching a model to a problem or situation is not a complete crap shoot. They find patterns, figure out ways to estimate initial velocity or calculate acceleration and solidify one parameter to the model before adjusting another.

Computational models form one of the only ways I’ve found that successfully allows students of different skill levels to go from concrete to abstract reasoning in the context of problem solving in physics. Here’s the way the progression goes up the ladder of abstraction for the example I showed above:

  1. The maximum height of the ball occurred at that time. Student points to the graph.
  2. The maximum height of the ball happened when the velocity of the ball went to zero in this situation. I’ll need to adjust my model to find this time for different problems.
  3. The maximum height of the ball always occurs when the velocity of the ball goes to zero. We can get this approximate time from the graph.
  4. I can model the velocity algebraically and figure out when the ball velocity goes to zero exactly. Then we can use the area to find the maximum height.
  5. I can use the algebraic model for velocity to find the time when the ball has zero velocity. I can then create an algebraic model for position to get the position of the ball at this time.

My old students had to launch themselves up to step five of that progression from the beginning with an algebraic treatment. They had to figure out how the algebraic models related to the problems I gave them. They eventually figured it out, but it was a rough slog through the process. This was my approach for the AP physics students, but I used a mathematical approach for the regular students as well because I thought they could handle it. They did handle it, but as a math problem first. At the end, they returned to physics land and figured out what their answers meant.

There’s a lot going on here that I need to process, and it could be that I’m too tired to see the major flaws in this approach. I’m constantly asking myself ‘why’ algebraic derivations are important. I still do them in some way, which means I still see some value, but the question remains. Abstracting concepts to general cases in physics is important because it is what physicists do. It’s the same reason we should be modeling the scientific method and the modeling process with students in both science and math classes – it’s how professionals work within the field.

Is it, however, how we should be exposing students to content?

Programming and Making Use of Structure in Math

A tweet from James Tanton caught my eye last night:

Frequent readers likely know about my obsession with playing around the borders of computational thinking and mathematical reasoning. This question from James has some richness that I think brings out the strengths of considering both approaches quite nicely. For one of the few times I can remember since starting my teaching career, I went to a computational solution before analyzing it analytically.

A computational approach is pretty simple. In Python:


sum = 0
for i in range(1,11):
for j in range(1,11):
sum += i*j
print(sum)

…and in Javascript:

sum = 0
for(i=1;i

The basic idea is the same in both languages. We iterate over each number in the first row and column of the multiplication table and add them up. From a first look, one could call this a brute force way to a solution, and therefore not elegant from a mathematical standpoint.

Taking this approach does, however, reveal some of the underlying mathematical structure that is needed to resolve this using other techniques. The sequence below is exactly how I analyzed the problem once I had written the program to solve it:

  • For a single row of the table, we are adding together the elements of that row. Instead of adding the individual elements together one by one, we could instead think about finding the sum of the elements of a single row, and then add together all of the rows. For example: \(1 + 2 + 3 + ... + 10 = 55\). This is a simple arithmetic series.
  • Each row is the same as the row before it, aside from each element being multiplied by the first element in the row. Every row's sum therefore is being multiplied by the numbers in the first column of the table. \(1(1+2+3...+10)+2(1+2+3...+10)+3(1+2+3+...+10)+...+10(1+2+3+...+10)\).
  • Taking this one step further, this is equivalent to the sum of that first row multiplying the sum of the first column: \((1 + 2 + 3 + ... + 10)(1 + 2 + 3 + ... + 10)\). In other words, the answer to our problem is really the square of the sum of that first row (or column), or 55*55.

I bring up this problem because I think it suggests a useful connection between a practical method of solving a problem, and what we often expect in the world of classroom mathematics. This is clearly a great application of concepts behind a traditional presentation of arithmetic series, and a teacher might give this as part of such a unit to see if students are able to see the structure of the arithmetic series formulas within it.

My question is what a teacher does if he or she presents this problem and the students don't make that connection. Is the next step a whole class discussion about how to proceed? Is it a leading question asking how arithmetic series applies here? This, by the way, zaps the whole point of the activity if the goal was to see if students see that underlying structure based on what they already know. Once this happens, it becomes yet another 'example' presented to the class.

I wonder what happens if a computer/spreadsheet solution is consistently recognized throughout the class as a viable tool to investigate problems like this. A computer solution is really nothing more than an abstraction of the process of adding the numbers together one by one. If a student did actually do this by hand, we'd groan and ask if they thought there was a better way, and the response inevitably is 'yes, but I don't know a better way'. In the way I found myself thinking about this problem last night, I started from the computational method, discovered the structure from those computations, and then found a path toward a more elegant solution using algebraic techniques.

In other words, I made use of the structure of my program to identify an analytical approach. Contrast this with a more traditional approach where we start with an abstract definition of an arithmetic series (by hand), do practice problems (by hand) and once we understand how it works, use computational shortcuts.

The consistent power that I see in approaching and developing ideas with students from a computational standpoint first is not that it often makes it easier to find an answer, though that can be a good thing when the goal is to find an answer. Computational methods can make it easy to change things around and generalize a problem - what Polya termed generalization. It's easy to change the Javascript program to this and ask what multiplication table it models:


sum = 0
for(i=5;i

Computation makes the process of finding a more elegant way seems much more natural - in the best situations, it builds intellectual need for an easier way. It is arbitrary to say that a student should be able to do a problem without a calculator. Computational tools demand that we find a more compelling reason to solve problems by hand if computers are able to do them rapidly once they are set up to solve them through programming. It is a realistic motivation to show that an easier way speeds up finding a solution to a problem by a factor of 10. It means less waiting for a web page to load or an image to post.

The language of mathematics is difficult enough to throw in the additional complications of computer language syntax. I fully acknowledge that this is a hurdle. I also think, however, that this syntax is more closely related to the concepts that we are trying to teach our students (3*x is three times x) than we sometimes think. The power of computer programming to be a bridge between the hand calculations that our students do and the abstractions of the mathematical content we teach is too great to ignore.

Math Caching and Immediately Useful Teaching Data

Last July, I posted a video in which I showed how to create a local, customized version of the Math Caching activity that can be found here.

I was inspired to revisit the idea last weekend reading Dan Meyer’s post about teacher dashboards. The part that got me thinking, and that stoked the fire that has been going in my head for a while, is identifying the information that is most useful to teachers. There are common errors that an experienced teacher knows to expect, but a new teacher may not recognize is common until it is too late. Getting a measure of wrong answers, and more importantly, the origin of those wrong answers, is where we ideally should be making the most of the technology in our (and the students’) hands. Anything that streamlines the process of getting a teacher to see the details of what students are doing incorrectly (and not just that they are getting something wrong) is valuable. The only way I get this information is by looking at student work. I need to get my hands on student responses as quickly as I can to make sense of what they are thinking.

As we were closing in on the end of an algebra review unit with the ninth graders this week, I realized that the math cache concept was good and fun and at a minimum was a remastering of the review sheet for a one-to-one laptop classroom. I came up with a number of questions and loaded it into the Python program. When one of my Calculus students stopped in to chat, and I showed her what I had put together, I told her that I was thinking of adding a step where students had to upload a screenshot of their written work in addition to entering their answer into the location box. She stared at me and said blankly: ‘You absolutely have to do that. They’ll cheat otherwise.’

Screen Shot 2013-09-20 at 11.23.26 PM

While I was a bit more optimistic, I’m glad that I took the extra time to add an upload button on the page. I configured the program so that each image that was uploaded was also labeled with the answer that the student entered into the box. This way, given that I knew what the correct answers were, I knew which images I might want to look at to know what students were getting wrong.

This was pure gold.

Screen Shot 2013-09-20 at 11.30.23 PM

Material like this was quickly filling up the image directory, and I watched it happening. I immediately knew which students I needed to have a conversation with. The answers ranged from ‘no solution’ to ‘identity’ to ‘x = 0’ and I instantly had material to start a conversation with the class. Furthermore, I didn’t need to throw out the tragically predictable ‘who wants to share their work’ to a class of students that don’t tend to want to share for all sorts of valid reasons. I didn’t have to cold call a student to reluctantly show what he or she did for the problem. I had their work and could hand pick what I wanted to share with the class while maintaining their anonymity. We could quickly look at multiple students’ work and talk about the positive aspects of each one, while highlighting ways to make it even better.

In this problem, we had a fantastic discussion about communicating both reasoning and process:

Screen Shot 2013-09-20 at 11.43.02 PM

The next step that I’d like to make is to have this process of seeing all of the responses be even more transparent. I’d like to see student work popping up in a gallery that I can browse and choose certain responses to share with the class. Another option to pursue is to get students seeing the responses of their peers and offer advice.

Automatic grading certainly makes the job of answering the right/wrong question much easier. Sometimes a student does need to know whether an answer is correct or not. Given all the ways that a student could game the system (some students did discuss using Wolfram Alpha during the activity) the informative part on the teaching and assessment end is seeing the work itself. This is also an easy source of material for discussion with other teachers about student work (such as with Michael Pershan’s Math Mistakes).

I was blown away with how my crude hack to add this feature this morning made the class period a much richer opportunity to get students sharing and talking about their work. Now I’m excited to work on the next iteration of this idea.

Computational Thinking and Algebraic Expressions

I am still reviewing algebra concepts in my Math 9 course with students. The whole unit is all about algebraic operations, but my students have seen this material at least once, in some cases two years running.

Not long ago, I made the assertion that the most harmful part of introducing students to the world of real-world algebra looks like this:

Let x = the number of ________

Why is this so harmful?

For practiced mathematicians, math teachers, and students that have endured school math for long enough, there are a couple steps that actually happen internally before this step of defining variables. Establishing a context for the numbers and the operations that link them together are the most important part of producing a correct mathematical model for a given situation. A level of intuition and experience is necessary if one is going to successfully skip straight to this step, and most students don’t have this intuition or experience.

We have to start with the concrete because most people (including our students) start their thinking in concrete terms. This is the reason I have raved previously about the CME Project and the effectiveness of using their guess-check-generalize concept in introducing word problems to students. It forms an effective bridge between the numbers that students understand and the abstract concept of a variable. It encourages experimentation and analysis of whether a given answer matches the constraints of a problem.

This method, however, screams for computers to take care of the arithmetic so that students can focus on manipulating the variables involved. Almost all of the Common Core Standards for Mathematical Practice point toward this being an important focus for our work with students. I haven’t had a great point in my curriculum since I really started getting into computational thinking to try out my ideas from the beginning, but today gave me a chance to do just that.

Here’s how I introduced students to what I wanted them to do:

I then had them open up this spreadsheet and actually complete the missing elements of the spreadsheet on their own. Some students had learned to do similar tasks in a technology class, but some had not.
02 – SPR – Translating Algebraic Expressions

Screen Shot 2013-09-06 at 3.59.38 PM

The students that needed to have conversations about tricky concepts like three less than a number had them with me and with other students when they came up. Students that didn’t quickly moved through the first set. I’d go and throw some different numbers for ‘a number’ and see that they were all changing as expected. Then we moved to a more abstract task:

It’s great to see that you know how to use different operations on the number in that cell. Now let’s generalize. Pick a variable you like – x, or N, or W – it doesn’t matter. What would each of these cells become then? Write those results together with the words in your notebook and show me when you’re done.

The ease with which students moved to this next task was much greater than it has ever been for me in past lessons. We also had some really great conversations about x*2 compared with 2x, and the fact that both are correct from an arithmetic standpoint, but one is more ‘traditional’ than the other.

Once students got to this point, I pushed them toward a slightly higher level task that still began concrete. This is the second sheet from the spreadsheet above:
Screen Shot 2013-09-06 at 4.06.07 PM

Here we had multiple variables going at once, but this was not a stretch for most students. The key that I needed to emphasize here for some students was that the red text was all calculated. I wanted to put information in the black boxes with black text only, and have the spreadsheet calculate the red values. This required students to identify what the relationship between the variables needed to be to obtain the answer they knew in their head had to be true. This is CCSS MP2, almost verbatim.

This is all solidifying into a coherent framework of using spreadsheet and programming tools to reinforce algebra instruction from the start. There’s still plenty to figure out, but this is a start. I’ll share what I come up with along the way.

Algebra and Programming – A Peek Ahead

I’m starting a new unit reviewing algebraic skills tomorrow. My students have most certainly moved through evaluating algebraic expressions, solving linear equations, and combining like terms before. Much of tomorrow’s class will involve me drifting between students working on this to get an idea of their skill level – certainly not a developmental lesson on these ideas unless I really see the need.

My question is on making these concepts new. The thing that comes to mind most immediately is using this as an opportunity to get students started on concepts of computational thinking. Students have seen the concepts of variables, substitution, and evaluation, but I think (and hope) that the ideas of using a computer to do these things is new enough to whet their appetites to potentially learn more.

What does the computer do well? (Compute).

What must we do to get it to do so? (Communicate to the computer correctly what we want to compute.)

After having my students do some algebraic evaluation on their own, I’m having them watch this short video:
M9 U2D1.1 – Web Browser & Math Hacking

Side Note:

Now that I see I can increase the font size in Chrome for the console, or zoom in using Camtasia, I can make the code much more visible than it is now. Work for the morning.

I can’t see an easier way to get students into a programming environment than this. Everyone has a web browser, and Safari and Chrome both give access to a Javascript console without too much work. There are websites like Code Academy that have a similar environment on their front page, but this method barely even requires accessing a web page.

I’ve had students install Python on their computers before, and it works well enough as long as there aren’t any operating system related hiccups. (IDLE does not run so well on OSX 10.5). I just like that this Javascript environment is hiding on student computers without having to do anything.

Other thoughts:

  • We have to tell the computer explicitly that 2x is 2*x. This is a fact that often gets glossed over when students haven’t seen it for a while.
  • Javascript doesn’t have an easy to access exponent symbol like Python or other languages do. To enter x3, you have to either type x*x*x (reinforcing the idea of the exponent for the win) or Math.pow(x,3) which is too abstract to even consider using with students.
  • Selling programming as a fast and easily accessible calculator isn’t a compelling pitch – I completely get that. At this point though, I’m not trying to sell the computer as the way to do things. My students all have computers with them in their classes. If making them unafraid to do something that feels a bit ‘under the hood’ might lead them to know what else is possible (which is a pitch that is coming really soon), I’m happy with this.

Half Full Activity – Results and Debrief

Screen Shot 2013-07-10 at 7.07.48 AM

If you haven’t yet participated, visit http://apps.evanweinberg.org/halffull/ and see what it’s all about. If I’ve ever written a post that has a spoiler, it’s this one.

First, the background.

“A great application of fractions is in cooking.”

At a presentation I gave a few months ago, I polled the group for applications of fractions. As I expected, cooking came up. I had coyly included this on the next slide because I knew it would be mentioned, and because I wanted the opportunity to call BS.

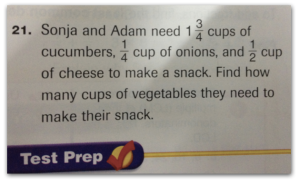
While it is true that cooking is probably the most common activity where people see fractions, the operations people learn in school are never really used in that context. In a math textbook, using fractions looks like this:

Screen Shot 2013-07-10 at 7.15.13 AM

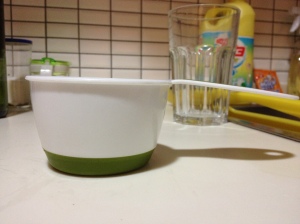
In the kitchen, it looks more like this:
IMG_0571

A recipe calls for half of a cup of flour, but you only have a 1 cup measure, and to be annoying, let’s say a 1/4 cup as well. Is it likely that a person will actually fill up two 1/4 cups with flour to measure it out exactly? It’s certainly possible. I would bet that in an effort to save time (and avoid the stress that is common to having to recall math from grade school) most people would just fill up the measuring cup halfway. This is a triumph of one’s intuition to the benefits associated with using a more mathematical methods. In all likelihood, the recipe will turn out just fine.

As I argued in a previous post, this is why most people say they haven’t needed the math they learned in school in the real world. Intuition and experience serve much better (in their eyes) than the tools they learned to use.

My counterargument is that while relying on human intuition might be easy, intuition can also be wrong. The mathematical tools help provide answers in situations where that intuition might be off and allows the error of intuition to be quantified. The first step is showing how close one’s intuition is to the correct answer, and how a large group of people might share that incorrect intuition.

Thus, the idea for half full was born.

The results after 791 submissions: (Links to the graphs on my new fave plot.ly are at the bottom of the post.)

Rectangle

Screen Shot 2013-07-10 at 7.42.14 AM
Mean = 50.07, Standard Deviation = 8.049

Trapezoid

Screen Shot 2013-07-10 at 7.47.10 AM
Mean = 42.30, Standard Deviation = 9.967

Triangle

Screen Shot 2013-07-10 at 7.50.55 AM
Mean = 48.48, Standard Deviation = 14.90

Parabola

Screen Shot 2013-07-10 at 7.55.34 AM
Mean = 51.16, Standard Deviation = 16.93

First impressions:

  • With the exception of the trapezoid, the mean is right on the money. Seems to be a good example of wisdom of the crowd in action.
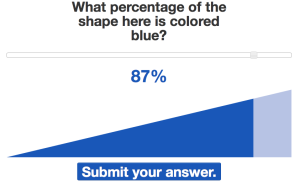
  • As expected, people were pretty good at estimating the middle of a rectangle. The consistency (standard deviation) was about the same between the rectangle and the trapezoid, though most people pegged the half-way mark lower than it actually was on the trapezoid. This variation increased with the parabola.
  • Some people clicked through all four without changing anything, thus the group of white lines close to the left end in each set of results. Slackers.
  • Some people clearly went to the pages with the percentage shown, found the correct location, and then resubmitted their answers. I know this both because I have seen the raw data and know the answers, and because there is a peak in the trapezoid results where a calculation error incorrectly read ‘50%’.

    I find this simultaneously hilarious, adorable, and enlightening as to the engagement level of the activity.

Second Impressions

  • As expected, people are pretty good at estimating percentage when the cross section is uniform. This changes quickly when the cross section is not uniform, and even more quickly when a curve is involved. Let’s look at that measuring cup again:
    IMG_0571

    In a cooking context, being off doesn’t matter that much with an experienced cook, who is able to get everything to balance out in the end. My grandmother rarely used any measuring tools, much to the dismay of anyone trying to learn a recipe from her purely from observing her in the kitchen. The variation inherent in doing this might be what it means to cook with love.

  • My dad mentioned the idea of providing a score and a scoreboard for each person participating. I like the idea, and thought about it before making this public, but decided not to do so for two reasons. One, I was excited about this and wanted to get it out. Two, I knew there would probably be some gaming the system based on resubmitting answers. This could have been prevented through programming, but again, it wasn’t my priority.
  • Jared (@jaredcosulich) suggested showing the percentage before submitting and moving on to the next shape. This would be cool, and might be something I can change in a later revision. I wanted to get all four numbers submitted for each user before showing how close that user was in each case.
  • Anyone who wants to do further analysis can check out the raw data in the link below. Something to think about : The first 550 entries or so were from my announcement on Twitter. At that point, I also let the cat out of the bag on Facebook. It would be interesting to see if there are any data differences between what is likely a math teacher community (Twitter) and a more general population.

This activity (along with the Do You Know Blue) along with the amazing work that Dave Major has done, suggests a three act structure that builds on Dan Meyer’s original three act sequence. It starts with the same basic premise of Act 1 – a simple, engaging, and non-threatening activity that gets students to make a guess. The new part (1B?) is a phase that allows the student to play with that guess and get feedback on how it relates to the system/situation/problem. The student can get some intuition on the problem or situation by playing with it (a la color swatches in Do You Know Blue or the second part of Half Full). This act is also inherently social in that students easily share and see the work of other students real time.

The final part of this Act 1 is the posing of a problem that now twists things around. For Half Full, it was this:

Screen Shot 2013-07-10 at 8.37.30 AM

Now that the students are invested (if the task is sufficiently engaging) and have some intuition (without the formalism and abstraction baggage that comes with mathematical tools in school), this problem has a bit more meaning. It’s like a second Act 1 but contained within the original problem. It allows for a drier or more abstract original problem with the intuition and experience acting as a scaffold to help the student along.

This deserves a separate post to really figure out how this might work. It’s clear that this is a strength of the digital medium that cannot be efficiently done without technology.

I also realize that I haven’t talked at all about that final page in my activity and the data – that will come later.

A big thank you to Dan Meyer for his notes in helping improve the UI and UX for the whole activity, and to Dave Major for his experience and advice in translating Dan’s suggestions into code.


Handouts:

Graphs

The histograms were all made using plot.ly. If you haven’t played around with this yet, you need to do so right away.

Rectangle: https://plot.ly/~emwdx/10

Trapezoid: https://plot.ly/~emwdx/11

Triangle: https://plot.ly/~emwdx/13

Parabola: https://plot.ly/~emwdx/8

Raw Data for the results presented can be found at this Google Spreadsheet.

Technical Details

  • Server side stuff done using the Bottle Framework.
  • Client side done using Javascript, jQuery, jQueryUI, Raphael for graphics, and JSONP.
  • I learned a lot of the mechanics of getting data through JSONP from Chapter 6 of Head First HTML5 Programming. If you want to learn how to make this type of tool for yourself, I really like the style of the Head First series.
  • Hosting for the app is through WebFaction.
  • Code for the activity can be found here at Github.
1 3 4 5 6 7 8