Half Full Activity – Results and Debrief

Screen Shot 2013-07-10 at 7.07.48 AM

If you haven’t yet participated, visit http://apps.evanweinberg.org/halffull/ and see what it’s all about. If I’ve ever written a post that has a spoiler, it’s this one.

First, the background.

“A great application of fractions is in cooking.”

At a presentation I gave a few months ago, I polled the group for applications of fractions. As I expected, cooking came up. I had coyly included this on the next slide because I knew it would be mentioned, and because I wanted the opportunity to call BS.

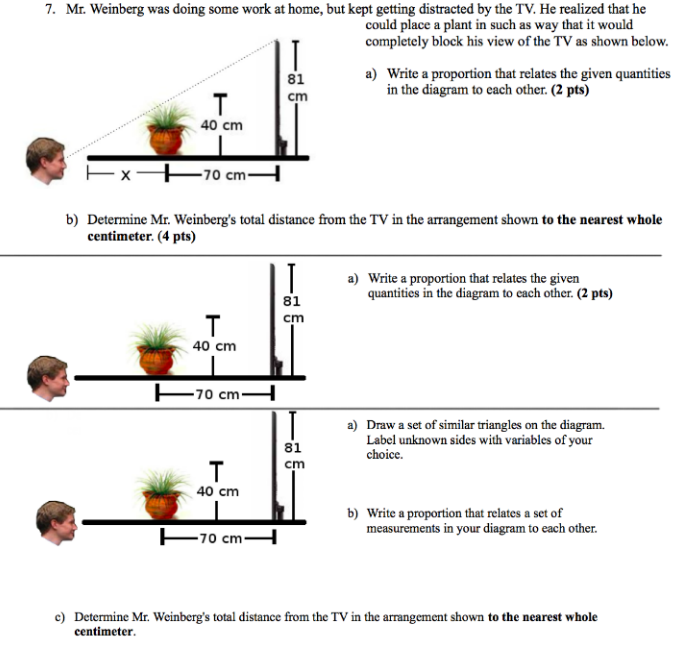
While it is true that cooking is probably the most common activity where people see fractions, the operations people learn in school are never really used in that context. In a math textbook, using fractions looks like this:

Screen Shot 2013-07-10 at 7.15.13 AM

In the kitchen, it looks more like this:
IMG_0571

A recipe calls for half of a cup of flour, but you only have a 1 cup measure, and to be annoying, let’s say a 1/4 cup as well. Is it likely that a person will actually fill up two 1/4 cups with flour to measure it out exactly? It’s certainly possible. I would bet that in an effort to save time (and avoid the stress that is common to having to recall math from grade school) most people would just fill up the measuring cup halfway. This is a triumph of one’s intuition to the benefits associated with using a more mathematical methods. In all likelihood, the recipe will turn out just fine.

As I argued in a previous post, this is why most people say they haven’t needed the math they learned in school in the real world. Intuition and experience serve much better (in their eyes) than the tools they learned to use.

My counterargument is that while relying on human intuition might be easy, intuition can also be wrong. The mathematical tools help provide answers in situations where that intuition might be off and allows the error of intuition to be quantified. The first step is showing how close one’s intuition is to the correct answer, and how a large group of people might share that incorrect intuition.

Thus, the idea for half full was born.

The results after 791 submissions: (Links to the graphs on my new fave plot.ly are at the bottom of the post.)

Rectangle

Screen Shot 2013-07-10 at 7.42.14 AM
Mean = 50.07, Standard Deviation = 8.049

Trapezoid

Screen Shot 2013-07-10 at 7.47.10 AM
Mean = 42.30, Standard Deviation = 9.967

Triangle

Screen Shot 2013-07-10 at 7.50.55 AM
Mean = 48.48, Standard Deviation = 14.90

Parabola

Screen Shot 2013-07-10 at 7.55.34 AM
Mean = 51.16, Standard Deviation = 16.93

First impressions:

  • With the exception of the trapezoid, the mean is right on the money. Seems to be a good example of wisdom of the crowd in action.
  • As expected, people were pretty good at estimating the middle of a rectangle. The consistency (standard deviation) was about the same between the rectangle and the trapezoid, though most people pegged the half-way mark lower than it actually was on the trapezoid. This variation increased with the parabola.
  • Some people clicked through all four without changing anything, thus the group of white lines close to the left end in each set of results. Slackers.
  • Some people clearly went to the pages with the percentage shown, found the correct location, and then resubmitted their answers. I know this both because I have seen the raw data and know the answers, and because there is a peak in the trapezoid results where a calculation error incorrectly read ‘50%’.

    I find this simultaneously hilarious, adorable, and enlightening as to the engagement level of the activity.

Second Impressions

  • As expected, people are pretty good at estimating percentage when the cross section is uniform. This changes quickly when the cross section is not uniform, and even more quickly when a curve is involved. Let’s look at that measuring cup again:
    IMG_0571

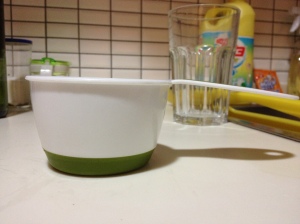
    In a cooking context, being off doesn’t matter that much with an experienced cook, who is able to get everything to balance out in the end. My grandmother rarely used any measuring tools, much to the dismay of anyone trying to learn a recipe from her purely from observing her in the kitchen. The variation inherent in doing this might be what it means to cook with love.

  • My dad mentioned the idea of providing a score and a scoreboard for each person participating. I like the idea, and thought about it before making this public, but decided not to do so for two reasons. One, I was excited about this and wanted to get it out. Two, I knew there would probably be some gaming the system based on resubmitting answers. This could have been prevented through programming, but again, it wasn’t my priority.
  • Jared (@jaredcosulich) suggested showing the percentage before submitting and moving on to the next shape. This would be cool, and might be something I can change in a later revision. I wanted to get all four numbers submitted for each user before showing how close that user was in each case.
  • Anyone who wants to do further analysis can check out the raw data in the link below. Something to think about : The first 550 entries or so were from my announcement on Twitter. At that point, I also let the cat out of the bag on Facebook. It would be interesting to see if there are any data differences between what is likely a math teacher community (Twitter) and a more general population.

This activity (along with the Do You Know Blue) along with the amazing work that Dave Major has done, suggests a three act structure that builds on Dan Meyer’s original three act sequence. It starts with the same basic premise of Act 1 – a simple, engaging, and non-threatening activity that gets students to make a guess. The new part (1B?) is a phase that allows the student to play with that guess and get feedback on how it relates to the system/situation/problem. The student can get some intuition on the problem or situation by playing with it (a la color swatches in Do You Know Blue or the second part of Half Full). This act is also inherently social in that students easily share and see the work of other students real time.

The final part of this Act 1 is the posing of a problem that now twists things around. For Half Full, it was this:

Screen Shot 2013-07-10 at 8.37.30 AM

Now that the students are invested (if the task is sufficiently engaging) and have some intuition (without the formalism and abstraction baggage that comes with mathematical tools in school), this problem has a bit more meaning. It’s like a second Act 1 but contained within the original problem. It allows for a drier or more abstract original problem with the intuition and experience acting as a scaffold to help the student along.

This deserves a separate post to really figure out how this might work. It’s clear that this is a strength of the digital medium that cannot be efficiently done without technology.

I also realize that I haven’t talked at all about that final page in my activity and the data – that will come later.

A big thank you to Dan Meyer for his notes in helping improve the UI and UX for the whole activity, and to Dave Major for his experience and advice in translating Dan’s suggestions into code.


Handouts:

Graphs

The histograms were all made using plot.ly. If you haven’t played around with this yet, you need to do so right away.

Rectangle: https://plot.ly/~emwdx/10

Trapezoid: https://plot.ly/~emwdx/11

Triangle: https://plot.ly/~emwdx/13

Parabola: https://plot.ly/~emwdx/8

Raw Data for the results presented can be found at this Google Spreadsheet.

Technical Details

  • Server side stuff done using the Bottle Framework.
  • Client side done using Javascript, jQuery, jQueryUI, Raphael for graphics, and JSONP.
  • I learned a lot of the mechanics of getting data through JSONP from Chapter 6 of Head First HTML5 Programming. If you want to learn how to make this type of tool for yourself, I really like the style of the Head First series.
  • Hosting for the app is through WebFaction.
  • Code for the activity can be found here at Github.

2012-2013 Year In Review – Learning Standards

This is the second post reflecting on this past year and I what I did with my students.

My first post is located here. I wrote about this year being the first time I went with standards based grading. One of the most important aspects of this process was creating the learning standards that focused the work of each unit.

What did I do?

I set out to create learning standards for each unit of my courses: Geometry, Advanced Algebra (not my title – this was an Algebra 2 sans trig), Calculus, and Physics. While I wanted to be able to do this for the entire semester at the beginning of the semester, I ended up doing it unit by unit due to time constraints. The content of my courses didn’t change relative to what I had done in previous years though, so it was more of a matter of deciding what themes existed in the content that could be distilled into standards. This involved some combination of concepts into one to prevent the situation of having too many. In some ways, this was a neat exercise to see that two separate concepts really weren’t that different. For example, seeing absolute value equations and inequalities as the same standard led to both a presentation and an assessment process that emphasized the common application of the absolute value definition to both situations.

What worked:

  • The most powerful payoff in creating the standards came at the end of the semester. Students were used to referring to the standards and knew that they were the first place to look for what they needed to study. Students would often ask for a review sheet for the entire semester. Having the standards document available made it easy to ask the students to find problems relating to each standard. This enabled them to then make their own review sheet and ask directed questions related to the standards they did not understand.
  • The standards focus on what students should be able to do. I tried to keep this focus so that students could simultaneously recognize the connection between the content (definitions, theorems, problem types) and what I would ask them to do with that content. My courses don’t involve much recall of facts and instead focus on applying concepts in a number of different situations. The standards helped me show that I valued this application.
  • Writing problems and assessing students was always in the context of the standards. I could give big picture, open-ended problems that required a bit more synthesis on the part of students than before. I could require that students write, read, and look up information needed for a problem and be creative in their presentation as they felt was appropriate. My focus was on seeing how well their work presented and demonstrated proficiency on these standards. They got experience and got feedback on their work (misspelling words in student videos was one) but my focus was on their understanding.
  • The number standards per unit was limited to 4-6 each…eventually. I quickly realized that 7 was on the edge of being too many, but had trouble cutting them down in some cases. In particular, I had trouble doing this with the differentiation unit in Calculus. To make it so that the unit wasn’t any more important than the others, each standard for that unit was weighted 80%, a fact that turned out not to be very important to students.

What needs work:

  • The vocabulary of the standards needs to be more precise and clearly communicated. I tried (and didn’t always succeed) to make it possible for a student to read a standard and understand what they had to be able to do. I realize now, looking back over them all, that I use certain words over and over again but have never specifically said what it means. What does it mean to ‘apply’ a concept? What about ‘relate’ a definition? These explanations don’t need to be in the standards themselves, but it is important that they be somewhere and be explained in some way so students can better understand them.
  • Example problems and references for each standard would be helpful in communicating their content. I wrote about this in my last post. Students generally understood the standards, but wanted specific problems that they were sure related to a particular standard.
  • Some of the specific content needs to be adjusted. This was my first year being much more deliberate in following the Modeling Physics curriculum. I haven’t, unfortunately, been able to attend a training workshop that would probably help me understand how to implement the curriculum more effectively. The unbalanced force unit was crammed in at the end of the first semester and worked through in a fairly superficial way. Not good, Weinberg.
  • Standards for non-content related skills need to be worked in to the scheme. I wanted to have some standards for year or semester long skills standards. For example, unit 5 in Geometry included a standard (not listed in my document below) on creating a presenting a multimedia proof. This was to provide students opportunities to learn to create a video in which they clearly communicate the steps and content of a geometric proof. They could create their video, submit it to me, and get feedback to make it better over time. I also would love to include some programming or computational thinking standards as well that students can work on long term. These standards need to be communicated and cultivated over a long period of time. They will otherwise be just like the others in terms of the rush at the end of the semester. I’ll think about these this summer.

You can see my standards in this Google document:
2012-2013 – Learning Standards

I’d love to hear your comments on these standards or on the post – comment away please!

Editing Khan

Let’s be clear – I don’t have a problem with most of the content on Khan Academy. Yes, there are mistakes. Yes, there are pedagogical choices that many educators don’t like. I don’t like how it has been sold as the solution to the educational ills of our world, but that isn’t my biggest objection to it.

I sat and watched his series on currency trading not too long ago. Given that his analogies and explanations are correct (which some colleagues have confirmed they are) he does a pretty good job of explaining the concepts in a way that I could understand. I guess that’s the thing that he is known for. I don’t have a problem with this – it’s always good to have good explainers out there.

The biggest issue I have with his videos is that they need an editor.

He repeats himself a lot. He will start explaining something, realize that he needs to back up, and then finishes a sentence that hadn’t really started. He will say something important and then slowly repeat it as he writes each word on the screen.

This is more than just an annoyance. Here’s why:

  • One of the major advantages to using video is that it can be good instruction distilled into great instruction. You can plan ahead with the examples you want to use. You can figure out how to say exactly what you need to say and nothing more, and either practice until you get it right, or just edit out the bad takes.
  • I have written and read definitions word by word on the board during direct instruction in my classes. I have watched my students faces as I do it. It’s clearly excruciating. Seeing that has forced me to resist the urge to speak as I write during class, and instead write the entire thing out before reading it. Even that doesn’t feel right as part of a solid presentation because I hate being read to, and so do my students. This doesn’t need to happen in videos.
  • If the goal of moving direct instruction to videos is to be as efficient as possible and minimize the time students spend sitting and watching rather than interacting with the content, the videos should be as short and efficient as possible. I’m not saying they should be void of personality or emotion. Khan’s conversational style is one of the high points of his material. I’m just saying that the ‘less is more’ principle applies here.

I spent an hour this morning editing one of the videos I watched on currency exchange to show what I mean. The initial length of the video was 12:03, and taking out the parts I mentioned earlier reduced it to 8:15. I think the result respects Khan’s presentation, but makes it a bit tighter and focused on what he is saying. Check it out:

The main reason I haven’t made more videos for my own classes (much to the dismay of my students, who really like them) is my insistence that the videos be efficient and short. I don’t want ten minute videos for my students to watch. I want two minutes of watching, and then two or three minutes of answering questions, discussing with other students, or applying the skills that they learned. My ratio is still about five minutes of editing time for every minute of the final video I make – this is roughly what it took this morning on the Khan Academy video too. This is too long of a process, but it’s a detail on using video that I care too much about to overlook.

What do you think?

2012-2013 Year In Review – Standards Based Grading

This is the first in a series of posts about things I did with my classes this year.

When I made the decision last fall to commit to standards based grading, these were the main unknowns that hung at the back of my mind:

  • How would students respond to the change?
  • How would my own use of SBG change over the course of the year?
  • How would using SBG change the way I plan, teach, and assess?

These questions will all be answered as I reflect in this post.

What did I do?

In the beginning of the year, I used a purely binary system of SBG – were students proficient or not? If they were proficient, they had a 5/5. Not yet proficient students received a 0/5 for a given standard. All of these scores included a 5 point base grade to be able to implement this in PowerSchool.

As the semester went on, the possible proficiency levels changed to a 0, 2.5, or 5. This was in response to students making progress in developing their skills (and getting feedback on their progress through Blue Harvest but not seeing visible changes to their course grade. As much as I encouraged students not to worry about the grade, I also wanted to be able to show progress through the breakdown of each unit’s skills through PowerSchool. It served as a communication channel to both parents and the students on what they were learning, and I could see students feeling a bit unsatisfied by getting a few questions correct, but not getting marked as proficient yet. I also figured out that I needed to do more work defining what it meant to be proficient before I could really run a binary system.

By the start of the second semester, I used this scheme for the meaning of each proficiency score:

  • 1 – You’ve demonstrated basic awareness of the vocabulary and definitions of the standard. You aren’t able to solve problems from start to finish, even with help, but you can answer yes/no or true or false questions correctly about the ideas for this standard.
  • 2 – You can solve a problem from start to finish with your notes, another student, or your teacher reminding you what you need to do. You are not only able to identify the vocabulary or definitions for a given skill, but can substitute values and write equations that can be solved to find values for definitions. If you are unable to solve an equation related to this standard due to weak algebra skills, you won’t be moving on to the next level on this standard.
  • 3 – You can independently solve a question related to the standard without help from notes, other students, or the teacher. This score is what you receive when you do well on a quiz assessing a single standard. This score will also be the maximum you will receive on this standard if you consistently make arithmetic or algebraic errors on problems related to this standard.
  • 4 – You have shown you can apply concepts related to this standard on an in-class exam or in another situation where you must identify which concepts are involved in solving a problem. This compares to success on a quiz on which you know the standard being assessed. You can apply the content of a standard in a new context that you have not seen before. You can clearly explain your reasoning, but have some difficulty using precise mathematical language.
  • 5 – You have met or exceeded the maximum expectations for proficiency on this standard. You have completed a project of your own design, written a program, or made some other creative demonstration of your ability to apply this standard together with other standards of the unit. You are able to clearly explain your reasoning in the context of precise mathematical definitions and language.

All of the standards in a unit were equally weighted. All units had between 5 and 7 standards. In most classes, the standards grade was 90% of the overall course grade, the exception being AP Calculus and AP Physics, where it was 30%. In contrast to first semester, students needed to sign up online for any standards they wanted to retake the following day. The maximum number of standards they could retake in a day was limited to two. I actually held students to this (again, in contrast to first semester), and I am really glad that I did.

Before I start my post, I need to thank Daniel Schneider for his brilliant post on how SBG changes everything here. I agree with the majority of his points, and will try not to repeat them below.

What worked:

  • Students were uniformly positive about being able to focus on specific skills or concepts separate from each other. The clarity of knowing that they needed to know led some students to be more independent in their learning. Some students made the conscious decision to not pursue certain standards that they felt were too difficult for them. The most positive aspect of their response was that students felt the system was, above all else, a fair representation of their understanding of the class.
  • Defining the standards at the beginning of the unit was incredibly useful for setting the course and the context for the lessons that followed. While I have previously spent time sketching a unit plan out of what I wanted students to be able to do at the end, SBG required me not only to define specifically what my students needed to do, but also to communicate that definition clearly to students. That last part is the game changer. It got both me and the students defining and exploring what it means to be proficient in the context of a specific skill. Rather than saying “you got these questions wrong”, I was able to say “you were able to answer this when I was there helping you, but not when I left you alone to do it without help. That’s a 2.”
  • SBG helped all students in the class be more involved and independent in making decisions about their own learning. The strongest students quickly figured out the basics of each standard and worked to apply them to as many different contexts as possible. They worked on communicating their ideas and digging in to solve difficult problems that probed the edges of their understanding. The weaker students could prioritize those standards that seemed easiest to them, and often framed their questions around the basic vocabulary, understanding definitions, and setting up a plan to a problem solution without necessarily knowing how to actually carry out that plan. I also changed my questions to students based on what I knew about their proficiency, and students came to understand that I was asking a level 1 question compared with a level 3 question. I also had some students giving a standards quiz back to me after deciding that they knew they weren’t ready to show me what they knew. They asked for retakes later on when they were prepared. That was pretty cool.
  • Every test question was another opportunity to demonstrate proficiency, not lose points. It was remarkably freeing to delete all of the point values from questions that I used from previous exams. Students also responded in a positive way. I found in some cases that because students weren’t sure which standard was being assessed, they were more willing to try on problems that they might have otherwise left blank. There’s still more work to be done on this, but I looked forward to grading exams to see what students did on the various problems. *Ok, maybe look forward is the wrong term. But it still was really cool to see student anxiety and fear about exams decrease to some extent.

What needs work:

  • Students want more detail in defining what each standard means. The students came up with the perfect way to address this – sample problems or questions that relate to each standard. While the students were pretty good at sorting problems at the end of the unit based on the relevant standards, they were not typically able to do this at the beginning. The earlier they understand what is involved in each standard, the more quickly they can focus their work to achieve proficiency. That’s an easy order to fill.
  • I need to do more outreach to parents on what the standards mean. I thought about making a video at the beginning of the year that showed the basics, but I realize now that it took me the entire year to understand exactly what I meant by the different standards grades. Now that I really understand the system better, I’ll be able to do an introduction when the new year begins.
  • The system didn’t help those students that refuse to do what they know they need to do to improve their learning. This system did help in helping these students know with even more clarity what they need to work on. I was not fully effective in helping all students act on this need in a way that worked for them.
  • Reassessment isn’t the ongoing process that it needs to be. I had 80 of the 162 reassessment requests for this semester happen in the last week of the semester. Luckily I made my reassessment system in Python work in time to make this less of a headache than it was at the end of the first semester. I made it a habit to regularly give standards quizzes between 1 or 2 classes after being exposed to the standard for the first time. These quizzes did not assess previous standards, however, so a student’s retake opportunities were squarely on his or her own shoulders. I’m not convinced this increased responsibility is a problem, but making it an ongoing part of my class needs to be a priority for planning the new year.

I am really glad to have made the step to SBG this year. It is the biggest structural change I’ve made to my grading policy ever. It led to some of the most candid and productive conversations with students about the learning learning process that I’ve ever had. I’m going to stop with the superlatives, even though they are warranted.

Milestones at the start of summer: A tribute

IMG_0720

I used this LEGO car in a five minute demo lesson – my first lesson ever – on Newton’s laws of motion. It was a gimmick to get the people in the room thinking about what they knew about forces, and served this purpose perfectly. This was in the beginning stages of my decision during my senior year at Tufts to pursue teaching rather than engineering after graduation.

It sat on the bookshelf next to my desk in both of my New York City apartments. It made its way into a suitcase that a friend took to Zambia. It was one of the items that I took out of the storage last summer with a smile, and was among the knick-knacks that didn’t get tossed in the move to the apartment in Hangzhou for next year.

This LEGO car rolled across the floor of the new apartment last week, the final week of my tenth year teaching. It made me think back to the many adventures that have been my life ever since I received my acceptance letter to the New York City Teaching Fellows program in 2003. I worked with an incredible group of teachers in the Bronx for seven years, helped open the KIPP NYC College Prep high school, and then made the move to Hangzhou where I have enjoyed teaching kids and working with some fantastic folks from all over the world.

Even though it is the start of summer vacation, my head is still very much in the teaching game. It’s gratifying to know that I can reinvent myself every year after a summer of reflection and meditation on what went well and what did not. I am motivated by my students comments in end-of-year surveys that my enthusiasm for learning and sharing new things gets them excited to be in the classroom with me. The unique experience of working with teenagers compels me to still devote energy and time to making myself better at what I do.

To the students that I have worked with over the past ten years: thank you for giving me the most exhilarating, satisfyingly unpredictable, and meaningful ten years I never knew I wanted in a career. To my colleagues: thank you for teaching me what it means to work hard for the right reasons and toward the right ends. To my family: thank you for supporting me in all that I do.

Have a great summer everyone!

Three Acts – Counting with dots and first graders

I had an amazing time this afternoon visiting my wife’s first grade class. I’ve been talking forever about how great it is to take a step out of the usual routines in class and look at a new problem, and my wife invited me in to try it with her students.

Here’s the run-down.

Act 1

[wpvideo 8kq5u3Cf]

Student questions (and the number of students that also found the questions interesting):

  • Why do the dots come together? (8)
  • Why are the dots making pictures and not telling us what they mean? (8)
  • Why are some dots going together into big dots, and others staying small? (13)
  • Why do some of the dots form blue lines before coming together?

My questions (and the number of students that humored me):

  • How many dots are there at the end? (8)
  • What is the final pattern of dots after the video ends? (11)

Guesses for the number of dots ranged from a low of 20 to a high of 90.

Act 2

What information did they want to know?

  • They wanted to see the video again.
  • Seven students asked about the numbers of tens or ones in each group. (I jumped on the use of that vocabulary right away – it seemed they are comfortable using this vocabulary based on my conversations with them.)
  • I showed them the video and gave them this handout since I didn’t have video players for all of the students:
    grouping dots

    What happened then was a series of amazing conversations with some really energetic and enthusiastic kids. They got right to work organizing and figuring out the patterns.
    Screen Shot 2013-06-11 at 3.29.15 PM

    Screen Shot 2013-06-11 at 3.31.36 PM

    Act 3

    We watched the video and discussed the results and how they got their answers. Lots of great examples of student-created systems for keeping track of their counting. We then watched the Act 3 video:
    [wpvideo N9OYqdqx]

    While nobody had the total number correct, I was quite impressed with their pride in being close. More interesting was how little they cared that they didn’t get the exact answer. I asked who was between 70 and 80, and a few kids raised their hands, and then the same with 50 – 70. One student was one off. Most were within ten or so of the correct answer. The relationship between the guesses and their answers after analysis was something we touched upon, but didn’t discuss outside of some one-on-one conversations.

    The absolute highlight of the lesson was when I asked why they thought nobody had the exact answer. One student walked up to the projector screen with out hesitation and pointed here:
    Screen Shot 2013-06-13 at 4.43.53 PM

    She said “this is what made it tough” and then sat back down.

    We had a little more time, so we watched a sequel video:
    [wpvideo xjc26Gjj]

    I asked what they saw that was different aside from the colors. One student said right away that he figured it out, the same student that first shouted out ‘tens!’ in Act 1. We lacked the time to go and figure it out, so we left it there as a challenge to figure out for the next class.

    Footnotes:

    • Any high school or middle school math teacher that wants to see how excited students can be when they are learning math needs to go take a group of elementary students through a three act. I wish I had done this during the dark February months when things drag for me. My wife asked me to do this to see how it works, but I think I got a lot more enjoyment out of the whole experience.
    • I made a conscious decision not to include any symbolic numbers in this exercise. It adds an extra layer of abstraction that takes away from the students figuring out what is going on. I almost put it back in when I wasn’t sure whether it was obvious enough. I am really glad I left it out so the students could prove that they didn’t need that crutch.
    • This is written in Javascript using Raphael. You can see a fully editable version of the code in this JSFiddle.
    • All files are posted at 101 Questions in case you want to get the whole package.

Assessing assessment over time – similar triangles & modeling

I’ve kept a question on my similar triangles unit exam over the past three years. While the spirit has generally been the same, I’ve tweaked it to address what seems most important about this kind of task:
Screen Shot 2013-04-30 at 3.27.28 PM

My students are generally pretty solid when it comes to seeing a proportion in a triangle and solving for an unknown side. A picture of a tree with a shadow and a triangle already drawn on it is not a modeling task – it is a similar triangles task. The following two elements of the similar triangles modeling concept seem most important to me in the long run:

  • Certain conditions make it possible to use similar triangles to make measurements. These conditions are the same conditions that make two triangles similar. I want my students to be able to use their knowledge of similarity theorems and postulates to complete the statement: “These triangles in the diagram I drew are similar because…”
  • Seeing similar triangles in a situation is a learned skill. Dan Meyer presented on this a year ago, and emphasized that a traditional approach rushes the abstraction of this concept without building a need for it. The heavy lifting for students is seeing the triangles, not solving the proportions.

If I can train students to see triangles around them (difficult), wonder if they are similar (more difficult), and then have confidence in knowing they can/can’t use them to find unknown measurements, I’ve done what I set out to do here. What still seems to be missing in this year’s version is the question of whether or not they actually are similar, or under what conditions are they similar. I assessed this elsewhere on the test, but it is so important to the concept of mathematical modeling as a lifestyle that I wish I had included it here.

(Students) thinking like computer scientists

It generally isn’t too difficult to program a computer to do exactly what you want it to do. This requires, however, that you know exactly what you want it to do. In the course of doing this, you make certain assumptions because you think you know beforehand what you want.

You set the thermostat to be 68º because you think that will be warm enough. Then when you realize that it isn’t, you continue to turn it up, then down, and eventually settle on a temperature. This process requires you as a human to constantly sense your environment, evaluate the conditions, and change an input such as the heat turning on or off to improve them. This is a continuous process that requires constant input. While the computer can maintain room temperature pretty effectively, deciding whether the temperature is a good one or not is something that cannot be done without human input.

The difficulty is figuring out exactly what you want. I can’t necessarily say what temperature I want the house to be. I can easily say ‘I’m too warm’ or ‘I’m too cold’ at any given time. A really smart house would be able to take those simple inputs and figure out what temperature I want.

I had an idea for a project for exploring this a couple of years ago. I could try to tell the computer using levels of red, green, and blue exactly what I thought would define something that looks ‘green’ to me. In reality, that’s completely backwards. The way I recognize something as being green never has anything to do with RGB, or hue or saturation – I look at it and say ‘yes’ or ‘no’. Given enough data points of what is and is not green, the computer should be able to find the pattern itself.

With the things I’ve learned recently programming in Python, I was finally able to make this happen last night: a page with a randomly selected color presented on each load:
Screen Shot 2013-04-18 at 9.51.51 PM

Sharing the website on Twitter, Facebook, and email last night, I was able to get friends, family, and students hammering the website with their own perceptions of what green does and does not look like. When I woke up this morning, there were 1,500 responses. By the time I left for school, there were more then 3,000, and tonight when my home router finally went offline (as it tends to do frequently here) there were more than 5,000. That’s plenty of data points to use.

I decided this was a perfect opportunity to get students finding their own patterns and rules for a classification problem like this. There was a clearly defined problem that was easy to communicate, and I had lots of real data data to use to check a theoretical rule against. I wrote a Python program that would take an arbitrary rule, apply it to the entire set of 3,000+ responses from the website, and compare its classifications of green/not green to that of the actual data set. A perfect rule for the data set would correctly predict the human data 100% of the time.

I was really impressed with how quickly the students got into it. I first had them go to the website and classify a string of colors as green or not green – some of them were instantly entranced b the unexpected therapeutic effect of clicking the buttons in response to the colors. I soon convinced them to move forward to the more active role of trying to figure out their own patterns. I pushed them to the http://www.colorpicker.com website to choose several colors that clearly were green, and others that were not, and try to identify a rule that described the RGB values for the green ones.

When they were ready, they started categorizing their examples and being explicit in the patterns they wanted to try. As they came up with their rules (e.g. green has the greatest level) we talked about writing that mathematically and symbolically – suddenly the students were quite naturally thinking about inequalities and how to write them correctly. (How often does that happen?) I showed them where I typed it into my Python script, and soon they were telling me what to type.

rgbwork

In the end, they figured out that the difference of the green compared to each of the other colors was the important element, something that I hadn’t tried when I was playing with it on my own earlier in the day. They really got into it. We had a spirited discussion about whether G+40>B or G>B+40 is correct for comparing the levels of green and blue.

In the end, their rule agreed with 93.1% of the human responses from the website, which beat my personal best of 92.66%. They clearly got a kick out of knowing that they had not only improved upon my answer, but that their logical thinking and mathematically defined rules did a good job of describing the thinking of thousands of people’s responses on this question. This was an abstract task, but they handled it beautifully, both a tribute to the simplicity of the task and to their own willingness to persist and figure it out. That’s perplexity as it is supposed to be.

Other notes:

  • One of the most powerful applications of computers in the classroom is getting students hands on real data – gobs of it. There is a visible level of satisfaction when students can talk about what they have done with thousands of data points that have meaning that they understand.
  • I happened upon the perceptron learning algorithm on Wikipedia and was even more excited to find that the article included Python code for the algorithm. I tweaked it to work with my data and had it train using just the first 20 responses to the website. Applying this rule to the checking script I used with the students, it correctly predicted 88% of the human responses. That impresses me to no end.
  • A relative suggested that I should have included a field on the front page for gender. While I think it may have cut down on the volume of responses, I am hitting myself for not thinking to do that sort of thing, just for analysis.
  • A student also indicated that there were many interesting bits of data that could be collected this way that interested her. First on the list was color-blindness. What does someone that is color blind see? Is it possible to use this concept to collect data that might help answer this question? This was something that was genuinely interesting to this student, and I’m intrigued and excited by the level of interest she expressed in this.
  • I plan to take a deeper look at this data soon enough – there are a lot of different aspects of it that interests me. Any suggestions?
  • Anyone that can help me apply other learning algorithms to this data gets a beer on me when we can meet in person.

Building a need for math – similar polygons & mobile devices

The focus of some of my out-of-classroom obsessions right now is on building the need for mathematical tools. I’m digging into the fact that many people do well on a daily basis without doing what they think is mathematical thinking. That’s not even my claim – it’s a fact. It’s why people also claim the irrelevance of math because what they see as math (school math) almost never enters the scene in one’s day-to-day interactions with the world.

The human brain is pretty darn good at estimating size or shape or eyeballing when it is safe to cross the street – there’s no arithmetic computation there, so one could argue that there’s no math either. The group of people feeling this way includes many adults, and a good number of my own students.

What interests me these days is spending time with them hovering around the boundary of the capabilities of the brain to do this sort of reasoning. What if the gut can’t do a good enough job of answering a question? This is when measurement, arithmetic, and other skills usually deemed mathematical come into play.

We spend a lot of time looking at our electronic devices. I posed this question to my Geometry and Algebra 2 classes on Monday:
Screen Shot 2013-04-10 at 2.45.41 PM

The votes were five for A, 5 for B, and 14 for C. There was some pretty solid debate about why they felt one way or another. They made sure to note that the corners of the phone were not portrayed accurately, but aside from that, they immediately saw that additional information was needed.

Some students took the image and made measurements in Geogebra. Some measured an actual 4S. Others used the engineering drawing I posted on the class blog. I had them post a quick explanation of their answers on their personal math blogs as part of the homework. The results revealed their reasoning which was often right on. It also showed some examples of flawed reasoning that I didn’t expect – something I now know I need to address in a future class.

At the end of class today when I had the Geometry class vote again, the results were a bit more consistent:
Screen Shot 2013-04-10 at 3.56.40 PM

The students know these devices. Even those that don’t have them know what they look like. It required them to make measurements and some calculations to know which was correct. The need for the mathematics was built in to the activity. It was so simple to get them to make a guess in the beginning based on their intuition, and then figure out what they needed to do, measure, or calculate to confirm their intuition through the idea of similarity. As another chance at understanding this sort of task, I ended today’s class with a similar challenge:

Screen Shot 2013-04-10 at 4.04.31 PM

My students spend much of their time staring at a Macbook screen that is dimensioned slightly off from standard television screen. (8:5 vs. 4:3). They do see the Smartboard in the classroom that has this shape, and I know they have seen it before. I am curious to see what happens.

1 2 3 4 5 6 9