
Speed of Sound Lab – Another Update
Two years ago, I wrote about how I took tuning forks out of the standard resonance tube lab for measuring the speed of sound.
My students all have phones and make a modest effort to keep them put away. I decided to get them to take them out for the lab today.
I found this free function generator app that generates clean sine, square, triangle, and sawtooth waves across a pretty good range. Above 1 kilohertz, harmonics are visible on a software frequency analyzer, so I didn’t have students go quite that high. The frequency can be set across this range by entering the frequency manually, or by using preset buttons on the app. By playing the waveform, plugging in earphones, and hanging them on top of the tube, finding the fundamental vibration frequency is pretty straight forward.
Collecting data in this lab has, in my experience, been a pretty slow process. Today though, my students were able to collect 15-20 frequency and height pairs in less than half an hour. I took all of their data and graphed it together. I’m pretty impressed with how consistently the data sits in a line:
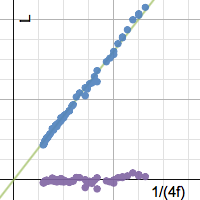
The slope of the best fit of L vs. 1/(4f) forced through the origin is 320 m/s, which is probably the closest result to theoretical that I’ve ever gotten. The precision of the data is the big winner here. It was a simple task to ask students to cycle back through their range of frequencies and check that their new measurements meshed well with the old.